US LPG Export Data 2025: US LPG Exports by Country & LPG Production Statistics
Explore the latest US LPG exports by country with detailed LPG export data & insights on US LPG production, shipment values, & global trade trends.
The United States has firmly established itself as the world’s leading exporter of liquefied petroleum gas (LPG), driven by abundant shale production, strong global demand, and expanding export infrastructure. By 2025, U.S. LPG exports reached near-record levels, reshaping global energy trade flows & influencing pricing dynamics across Asia, Europe, and emerging markets. According to the latest US export data and LPG export data of the USA, the total value of US LPG exports reached $363.89 million in 2025, a 10% decline from the previous year.
The USA is the 5th-largest LPG exporter in the world, according to global trade data. This blog breaks down the latest U.S. LPG export data for 2025, including export volumes, top importing countries, regional trends, and production statistics. It also explains the structural factors driving growth and what to expect going forward.
Overview of US LPG Exports in 2025
The U.S. LPG export market in 2025 remained strong despite trade constraints and geopolitical shifts, as per the reports of the U.S. Energy Information Administration. This growth has also boosted US natural gas exports, enabling the nation to strengthen its role among the top Petroleum gas exporters worldwide. As demand rises across residential, industrial, and petrochemical sectors, many nations are focusing on strategies to export LPG, making global trade more competitive and dynamic.
-
U.S. LPG exports declined by 10% in 2025.
-
Export volumes hovered around 2.3–2.5 million barrels per day (bpd) in early 2025.
-
Propane exports alone averaged 1.75 million bpd in 2024, forming the backbone of total LPG exports.
At peak periods, exports surged even higher:
-
February 2025 propane exports reached 2.25 million bpd
-
Total U.S. NGL (including LPG) exports hit 2.9 million bpd in April 2025
These numbers confirm a clear trend: The U.S. is not just a major LPG supplier; it is the dominant global exporter.
US LPG Supply Chain: From Shale to Ship
To understand export dominance, you need to understand the system.
How LPG Is Produced in the US
The global energy landscape is heavily influenced by LPG production by country, with major contributions from leading LPG-producing countries that continue to expand their refining and gas processing capacities. Among them, US LPG production has witnessed significant growth, supported by rising shale output and strong infrastructure, positioning the country as a key player in the US liquefied petroleum gas LPG market. LPG (primarily propane and butane) is not produced directly. It is a byproduct of two processes:
-
Natural gas processing (removing liquids from gas streams)
-
Crude oil refining
Key Production Basins
-
Permian Basin (Texas & New Mexico): Largest contributor due to associated gas growth
-
Marcellus/Utica (Appalachia): High ethane and propane yield
-
Eagle Ford (Texas): Mature but still significant
Fractionation and Storage
After extraction, raw NGLs are separated at fractionation hubs:
-
Mont Belvieu, Texas (global LPG pricing benchmark)
-
Conway, Kansas (secondary hub)
Mont Belvieu alone handles millions of barrels per day, acting as the pricing nerve center for global LPG trade.
US LPG Exports by Country: Where Does the US Export Liquefied Petroleum Gas?
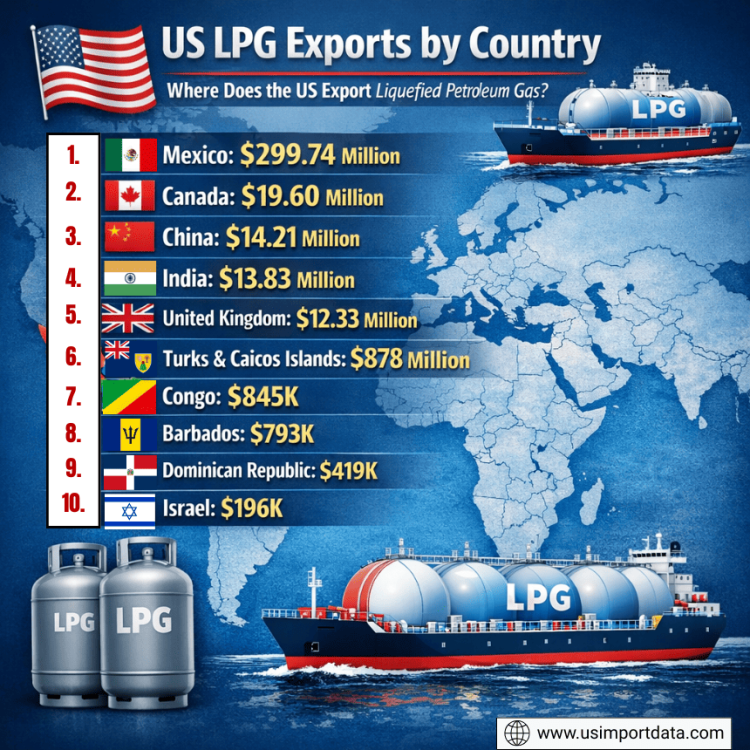
US LPG Exports by Country play a crucial role in the global energy market landscape, with the United States emerging as a significant player in liquefied petroleum gas exports. The US has been exporting LPG to various countries worldwide, with key destinations including Mexico, Canada, China, and India. With an abundance of natural gas resources and advanced infrastructure for processing and exporting LPG, the US has significantly increased its exports to countries worldwide. These exports have expanded the US market reach and strengthened its position as a leading supplier of LPG. The top 10 export destinations for American LPG exports, as per the US shipment data for 2025, include:
1. Mexico: $299.74 million (82.4%)
One of the largest importers of US LPG is Mexico. With a growing demand for clean energy sources, Mexico has turned to LPG as an alternative to traditional fuels. The proximity of the US to Mexico makes it a convenient and cost-effective source of LPG for the country.
2. Canada: $19.60 million (5.4%)
Canada is another significant market for US LPG exports. As a neighboring country with a well-established energy industry, Canada relies on imports of LPG to meet its energy needs. The US is a reliable supplier of LPG to Canada, helping to meet the country's demand for this versatile fuel.
3. China: $14.21 million (3.9%)
In recent years, China has emerged as a major market for US LPG exports. With a rapidly growing economy and increasing demand for energy, China has turned to LPG as a cleaner alternative to coal and oil. The US has become a key supplier of LPG to China, helping to meet the country's energy needs while reducing emissions.
4. India: $13.83 million (3.8%)
India is another important market for US LPG exports. With a growing population and increasing demand for energy, India has turned to LPG as a versatile and clean fuel source. The US has been able to meet India's demand for LPG, providing a reliable source of energy to help power the country's economy.
5. United Kingdom: $12.33 million (3.4%)
The United Kingdom has also become a significant market for US LPG exports, as per the data on US LPG exports to the United Kingdom by HS code. With a growing focus on reducing emissions and transitioning to cleaner energy sources, the UK has turned to LPG as a key component of its energy mix. The US has been able to supply LPG to the UK, helping to meet the country's energy needs sustainably.
6. Turks & Caicos Islands: $878 million (0.5%)
The Turks & Caicos Islands are a small but important market for US LPG exports. Located in the Caribbean, these islands rely on imports of LPG to meet their energy needs. The US has been able to supply LPG to the Turks & Caicos Islands, helping to support their economy and ensure a reliable source of energy for residents and businesses.
7. Congo: $845K (0.4%)
The Congo is another emerging market for US LPG exports. With a growing demand for energy and limited domestic resources, the Congo has turned to imports of LPG to meet its energy needs. The US has been able to supply LPG to the Congo, supporting economic growth and providing a clean energy source for the country.
8. Barbados: $793K (0.4%)
Barbados is a small but important market for US LPG exports. Located in the Caribbean, Barbados relies on imports of LPG to meet its energy needs. The US has been able to supply LPG to Barbados, supporting economic development and providing a reliable energy source for residents and businesses.
9. Dominican Republic: $419K (0.2%)
The Dominican Republic is another key market for US LPG exports. With a growing population and increasing energy demand, the Dominican Republic has turned to LPG as a clean and versatile fuel source. The US has been able to supply LPG to the Dominican Republic, helping to meet the country's energy needs while reducing emissions.
10. Israel: $196K (0.1%)
Israel is a small but growing market for US LPG exports. With a focus on increasing energy security and diversifying energy sources, Israel has turned to imports of LPG to meet its energy needs. The US has been able to supply LPG to Israel, supporting economic development and providing a reliable energy source for the country.
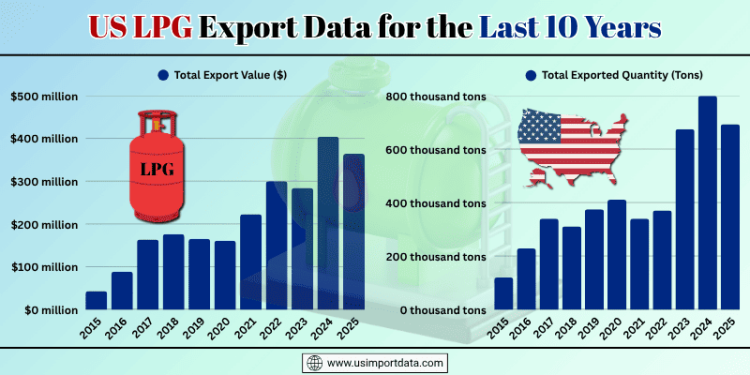
US LPG Export Data for the Last 10 Years
|
Year of Exports |
Total Export Value ($) |
Total Exported Quantity (Tons) |
|
2015 |
$43.10 million |
119.52 thousand tons |
|
2016 |
$88.67 million |
228.06 thousand tons |
|
2017 |
$163.45 million |
339.36 thousand tons |
|
2018 |
$176.13 million |
310.56 thousand tons |
|
2019 |
$165.08 million |
374.90 thousand tons |
|
2020 |
$161.03 million |
410.42 thousand tons |
|
2021 |
$222.90 million |
339.41 thousand tons |
|
2022 |
$300.16 million |
369.95 thousand tons |
|
2023 |
$284.15 million |
674.25 thousand tons |
|
2024 |
$403.86 million |
798.87 thousand tons |
|
2025 |
$363.89 million |
693.33 thousand tons |

US LPG Production Statistics (Granular Data)
Total LPG / NGL Production
|
Metric |
2023 |
2024 |
2025 (Est.) |
|
Total NGL Production |
6.4 mbpd |
6.8 mbpd |
7.1 mbpd |
|
LPG Share (Propane + Butane) |
2.6 mbpd |
2.8 mbpd |
3 mbpd |
|
Annual LPG (Million Tonnes) |
95 MT |
101 MT |
105–108 MT |
Breakdown by Product (2025 Estimates)
-
Propane: 70–75% of LPG exports
-
Normal Butane: 15–20%
-
Isobutane: smaller share (petrochemical blending)
Key Insight
Even though production continues to grow, the growth rate is slowing due to:
-
Lower drilling intensity vs 2022–2023
-
Capital discipline among shale producers
-
Infrastructure constraints
Export Volumes: Monthly and Seasonal Trends
Average Export Levels (2025)
-
Total LPG exports: 2.3–2.5 million bpd
-
Peak months: 2.7–2.9 million bpd
-
Seasonal low: 2.1 million bpd
Seasonality Pattern
|
Period |
Trend |
Reason |
|
Winter (Q1) |
High |
Heating demand (propane) |
|
Spring (Q2) |
Peak |
Petrochemical restocking |
|
Summer (Q3) |
Stable |
Balanced demand |
|
Winter Prep (Q4) |
Rising |
Inventory buildup |
Weekly Volatility
Exports can swing ±300,000 bpd week-to-week due to:
-
Weather (Gulf Coast storms/freezes)
-
Shipping congestion
-
Terminal maintenance
Europe’s Rising Role in USA LPG Exports
Europe has shifted from a secondary market to a major growth region.
Import Surge
-
Record imports of U.S. LPG in 2025
-
The Netherlands acts as a redistribution hub
Key Drivers
-
Reduced Russian energy supply
-
Petrochemical feedstock demand
-
Competitive U.S. pricing
Structural Change
Unlike past cycles, Europe’s demand is not temporary. It is becoming a long-term structural market for U.S. LPG.
Export Infrastructure: Capacity vs Demand
Major Export Terminals
-
Enterprise Products (Houston)
-
Energy Transfer (Nederland)
-
Targa Resources (Galena Park)
-
Phillips 66 (Freeport)
Capacity Snapshot (2025)
|
Metric |
Value |
|
Total Export Capacity |
1.8–2 million bpd (nameplate) |
|
Effective Throughput |
2.5+ million bpd (optimized) |
Bottlenecks
-
Berth congestion
-
Limited VLGC loading slots
-
Pipeline constraints into terminals
Key Insight
The U.S. is operating at or near maximum export efficiency, not maximum capacity. That’s a critical distinction.
LPG Demand Drivers by Sector
1. Residential Use
-
Cooking and heating
-
Dominant in India, Southeast Asia
2. Petrochemicals
-
Propane to Propylene (PDH plants)
-
Major demand driver in China and South Korea
3. Industrial Fuel
-
Alternative to coal and fuel oil
4. Transportation (Emerging)
-
Autogas usage is growing in some regions
Key Risks and Constraints
Infrastructure Constraints
The biggest limitation in 2025 is not supply; it’s trade.
Weather Risk
-
Gulf Coast hurricanes
-
Winter freezes
Geopolitical Risk
-
US–China trade tensions
-
Middle East supply competition
Environmental Policies
-
Energy transition could reduce fossil fuel demand in the long term.
-
But LPG is often seen as a transition fuel.
Competitive Landscape
US vs Middle East
|
Factor |
US |
Middle East |
|
Flexibility |
High |
Moderate |
|
Pricing |
Competitive |
Benchmark-linked |
|
Distance to Asia |
Longer |
Shorter |
|
Supply Growth |
Strong |
Stable |
Future Outlook (2026–2030)
Expected Trends
-
Export capacity expansion (new terminals)
-
Continued growth in India and Southeast Asia
-
Stable but volatile China demand
-
Increasing integration with petrochemical markets
Long-Term Projection
-
U.S. LPG exports could exceed 3 million bpd by 2027–2028.
-
Asia will remain the dominant demand center.
Conclusion and Final Takeaways
In conclusion, the U.S. LPG export market in 2025 reflects a mature yet rapidly evolving global energy system.
-
The U.S. is a top contributor to global LPG exports.
-
Export volumes in 2025 consistently exceed 2.3 million bpd.
-
Europe is emerging as a strategic long-term destination.
-
Infrastructure, not production, is the main constraint.
-
The US LPG trade is becoming more flexible, diversified, & interconnected.
Note For Our Readers
We hope that you liked our insightful blog report on the US LPG Exports Data 2025. If you need deeper insights or customized US LPG export data by country, company, or shipment level, feel free to connect with USImportdata and contact us at info@tradeimex.in for an exclusive database of US LPG suppliers & exporters.
What's Your Reaction?