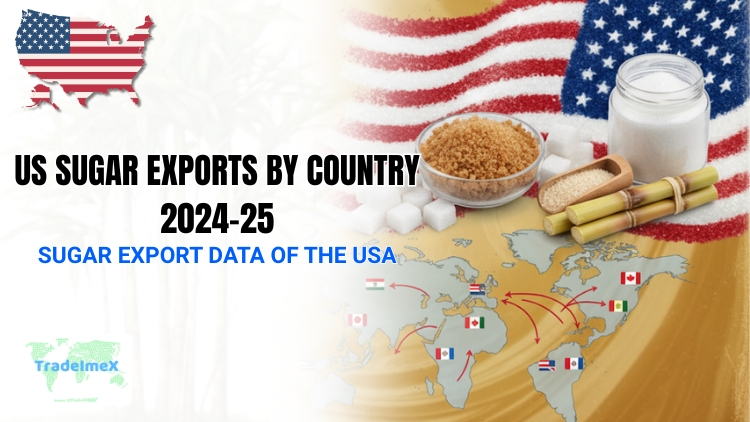
US Sugar Exports by Country 2024-25: Sugar Export Data of the USA
Explore US sugar exports by country with detailed USA sugar export data and insights into the U.S. sugar export market including top destinations trends and trade analysis.
Introduction
When people talk about the sugar trade in the United States, they usually focus on imports, how much sugar the U.S. brings in from places like Mexico, the Dominican Republic, or Brazil to meet its massive domestic demand. Yet, there’s another side to the story that often goes under the radar: U.S. sugar exports. According to the US export data and sugar export data of the USA, the total value of US sugar exports reached a record high $3 billion in 2024, a 10% increase from the previous year. According to the US sugar export data, the USA exported sugar worth $1.37 billion in the first two quarters of 2025.
The US is the 5th largest sugar exporter in the world, as per the global trade data. While the U.S. is not a major player on the world stage in terms of sugar exports compared to giants like Brazil, India, or Thailand, it still ships out a meaningful amount every year. These exports are an important component of the country’s trade balance, supply chain flexibility, and regional trade relationships, particularly within North America.
In 2024, U.S. sugar exports totaled roughly 2.44 million metric tons. This makes sugar a moderately sized export commodity for the agricultural sector, & the distribution of those exports reveals how trade relationships, exports, and global market dynamics shape America’s sweet trade footprint. In this article, we will explore the US sugar export data for 2024-25 in detail.
Overview of U.S. Sugar Exports
The Scale of the U.S. Sugar Export Market
Although the U.S. primarily focuses on satisfying domestic sugar consumption (which stands at around 12–13 million short tons raw value annually), its export volumes are not insignificant. In 2024, sugar exports accounted for nearly $3 billion in total trade value. This was up modestly compared to the three-year average of roughly $1.68 billion, signaling steady growth of around 2–3% annually over the past decade.
The global sugar export market is highly competitive, with Brazil recognized as the biggest exporter of sugar, followed by countries like India and Thailand. However, US sugar exports also play an important role in regional trade, particularly within North America. Many people ask, does the US export sugar? Yes, the United States exports both raw and refined sugar, mainly to Mexico and Canada. As a sugar exporter, the U.S. contributes to a steady global supply chain while maintaining strong domestic production. When analyzing sugar export by country, the U.S. consistently ranks among the top ten, highlighting its strategic importance in the international sugar market.
Export tonnage, estimated at 2.44 million metric tons as per the USDA Sugar Export Report, represents a small fraction of total U.S. production but still provides an outlet for domestic refiners, especially when production runs high.
Long-Term Export Trends
Over the past decade, U.S. sugar exports have followed a consistent pattern, steady, modest growth rather than volatility. The export sector is shaped by three major factors:
-
North American trade agreements (primarily with Mexico and Canada) facilitate low-cost, high-volume sugar flows.
-
Excess domestic production during years of strong beet and cane yields has led to surpluses that can be directed overseas.
-
Global sugar prices which affect competitiveness against top exporters like Brazil or Thailand.
Between 2015 and 2024, the export value of U.S. sugar increased from roughly $1.5 billion to nearly $2 billion, a reflection of both higher world sugar prices and slightly expanded market access.
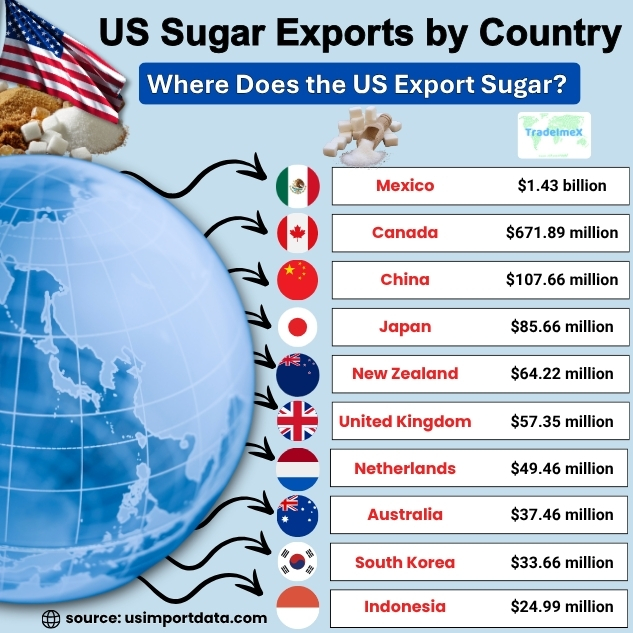
US Sugar Exports by Country: Where Does the US Export Sugar?
The United States is one of the leading producers of sugar in the world, with a significant portion of its production being exported to various countries around the globe. US sugar exports by country showcase the diverse destinations for US sugar products. Major export destinations for US sugar include Canada, Mexico, Japan, South Korea, and many countries in Central and South America. The most revealing aspect of the export picture is the breakdown by destination.
U.S. sugar exports are heavily concentrated in just a few countries, with Mexico and Canada together accounting for roughly 80 percent of total export value in 2024. These top ten markets account for over 90 percent of the US sugar export value. The remainder is distributed among smaller destinations across Central America, the Caribbean, and parts of Asia. These export markets play a crucial role in supporting the US sugar industry & maintaining global trade relationships. The top 10 sugar export destinations for the USA sugar exports, as per the US shipment data & sugar export statistics for 2024-25, include:
1. Mexico: $1.43 billion (47.8%)
Mexico is the top destination for US sugar exports, accounting for nearly half of the total export value. With a strong demand for sugar in the country, Mexico has become a key market for US sugar exporters.
2. Canada: $671.89 million (22.4%)
Canada is another significant market for US sugar exports, accounting for over 20% of the total export value. The proximity between the two countries makes Canada an attractive market for US sugar producers.
3. China: $107.66 million (3.6%)
Despite being a major player in the global sugar market, China still imports a significant amount of sugar from the US, as per the data on US sugar exports to China. With a growing economy and increasing consumption of sugar, China remains an important market for US sugar exports.
4. Japan: $85.66 million (2.9%)
Japan is another key market for US sugar exports, accounting for nearly 3% of the total export value. The high demand for sugar in Japan, coupled with the country's strict import regulations, makes it a lucrative market for US sugar producers.
5. New Zealand: $64.22 million (2.1%)
New Zealand may be a smaller market compared to other countries, but it still plays a significant role in US sugar exports. With a growing population and increasing demand for sugar, New Zealand provides valuable opportunities for US sugar producers.
6. United Kingdom: $57.35 million (1.9%)
The United Kingdom is another important market for US sugar exports, accounting for nearly 2% of the total export value, as per the data on US sugar exports to the United Kingdom by HS code. Despite being a relatively small country, the UK has a high demand for sugar, making it an attractive market for US sugar producers.
7. Netherlands: $49.46 million (1.6%)
The Netherlands is a major hub for trade in Europe, making it an important market for US sugar exports. With its strategic location and strong demand for sugar, the Netherlands continues to be a key destination for US sugar producers.
8. Australia: $37.46 million (1.2%)
Australia may be geographically distant from the US, but it remains a valuable market for US sugar exports. With its strong economy and high consumption of sugar, Australia provides significant opportunities for US sugar producers.
9. South Korea: $33.66 million (1.1%)
South Korea is another key market for US sugar exports, accounting for over 1% of the total export value. With a growing economy and increasing demand for sugar, South Korea offers promising prospects for US sugar producers.
10. Indonesia: $24.99 million (0.8%)
Indonesia rounds out the top 10 countries that import sugar from the US, accounting for nearly 1% of the total export value. As one of the largest economies in Southeast Asia, Indonesia presents valuable opportunities for US sugar producers.
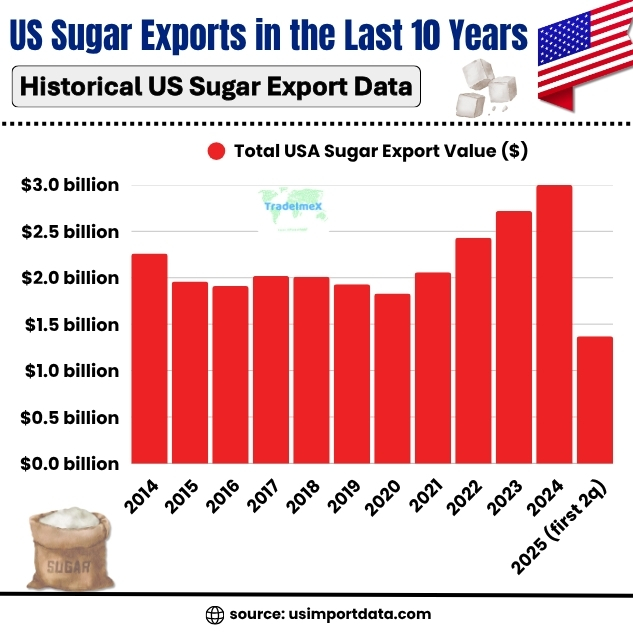
US Sugar Exports in the Last 10 Years: Historical US Sugar Export Data
|
Year of Exports |
Total USA Sugar Export Value ($) |
|
2014 |
$2.26 billion |
|
2015 |
$1.96 billion |
|
2016 |
$1.91 billion |
|
2017 |
$2.02 billion |
|
2018 |
$2.01 billion |
|
2019 |
$1.93 billion |
|
2020 |
$1.83 billion |
|
2021 |
$2.06 billion |
|
2022 |
$2.43 billion |
|
2023 |
$2.72 billion |
|
2024 |
$3 billion |
|
2025 (first 2 quarters) |
$1.37 billion |
Regional Analysis: Where the American Sugar Goes
1. North America (Mexico and Canada)
The United States’ sugar export trade is dominated by North America. Mexico alone accounts for more than half of the total export value, followed by Canada as the second-largest buyer.
This relationship is rooted in geography, supply chain efficiency, and the structure of the U.S.–Mexico–Canada Agreement (USMCA), which allows relatively smooth agricultural trade. The U.S. exports both raw and refined sugar to Mexico, though much of Mexico’s sugar imports are specialized or refined grades used for processing and blending.
Canada’s import demand for U.S. sugar is driven by its food manufacturing sector, which often relies on American sugar refineries for consistent quality and short delivery timelines. Canada’s close logistical proximity makes it one of the most cost-effective destinations for U.S. exporters.
2. Europe
Europe remains a minor but consistent market for U.S. sugar. With the European Union’s sugar sector undergoing restructuring and occasional shortfalls in refined sugar, small but regular shipments from the U.S. fill niche needs. The United Kingdom, post-Brexit, also represents a modest destination, particularly for specialty sugars used in the food and beverage industries.
3. Asia and Oceania
Japan, South Korea, China, and Australia collectively import a small share of U.S. sugar exports. These markets typically purchase refined sugar, not raw sugar, for industrial food manufacturing. Japan, in particular, values the purity and reliability of U.S. refined sugar and continues to import moderate volumes annually.
Australia’s imports are relatively surprising, given that it is itself a large sugar producer, but certain U.S. refined sugar products fit into niche industrial uses or come through reciprocal trade agreements involving re-export operations.
4. Latin America and the Caribbean
Guatemala and Colombia are notable among Latin American buyers. These trades are part of broader regional trade integration, sometimes involving re-exports, specialty sugars, or refined categories. Many smaller Latin American and Caribbean nations also import U.S. sugar in small but steady quantities for domestic processing industries.
Supply and Production Context (2024–25)
1. Record Domestic US Sugar Production
The United States’ sugar supply in 2024–25 is at a record high. Combined beet and cane sugar production is estimated at 9.3 million short tons raw value (STRV), the highest in modern history. Domestic beet yields in states like Minnesota, North Dakota, and Idaho have been particularly strong, while cane output in Louisiana and Florida remains stable.
This surge in production comes at a time when imports, particularly from Mexico, are falling. Imports from Mexico are projected to drop to about 395,000 STRV, the lowest in nearly two decades. With total supply projected at 14.3 million STRV, the U.S. sugar balance is tighter domestically, but still comfortable enough to allow moderate export levels.
2. Consumption and Stocks
U.S. sugar consumption in 2024/25 is projected at around 12.6 million STRV, leaving an ending stock-to-use ratio near 13–14 percent, higher than in many prior years. That ratio indicates a healthy buffer, meaning U.S. sugar producers have the flexibility to allocate a portion of supply toward export markets without disrupting domestic availability.
This supply balance supports the roughly 2.4 million metric tons of sugar exported in 2024 and suggests that similar export levels could continue in 2025, provided global demand and exports remain stable.
Economic and Trade Drivers
Comparative Advantages
While the U.S. cannot compete on price with global sugar giants like Brazil or India, it has unique advantages that sustain its export business:
-
Geographic proximity to major markets (especially Mexico and Canada).
-
High product quality and reliability, which attract industrial buyers.
-
Integrated exports across North America, reducing trade costs.
-
Refined sugar specialization, serving niche food and beverage applications.
Trade Agreements and Policy Factors
The U.S. sugar sector operates under complex domestic and international trade policies. Domestically, sugar production is supported by price support programs and import quotas that maintain stable domestic prices.
On the export side, trade agreements like USMCA streamline sugar movements within North America, but U.S. exports outside the region still face high global competition and, in some cases, tariffs. For example, the European Union and Asian markets often impose tariffs on imported sugar, limiting U.S. competitiveness there.
Global Comparison: US Sugar Exports vs. Major Exporters
To put the U.S. export performance in perspective:
-
Brazil exports more than 30 million metric tons of sugar annually.
-
India exports between 6–8 million metric tons, depending on subsidies and monsoon conditions.
-
Thailand typically exports 7–10 million metric tons.
-
The United States, by contrast, exports roughly 2.4 million metric tons, making it a mid-tier sugar exporter globally.
However, the U.S. export mix is more refined-sugar heavy. While other major exporters primarily ship raw sugar, the U.S. often exports refined, high-grade sugar products to neighboring and industrialized countries. This means its export value per ton is higher, even though overall volume is smaller.
Outlook for 2025 and Beyond
Stable to Slightly Higher Export Volumes
Given the record 2024/25 production and steady consumption, the outlook for 2025 suggests that U.S. sugar exports could remain stable or rise modestly. If global prices remain firm and North American demand continues, total exports might approach 2.5–2.6 million metric tons by late 2025.
Key Risks and Uncertainties
-
Global Price Fluctuations: A drop in world sugar prices could make U.S. exports less competitive.
-
Trade Policy Changes: Adjustments in US–Mexico sugar agreements or tariffs could shift trade balances.
-
Domestic Policy: U.S. sugar program adjustments, especially price support levels, could influence export availability.
Potential Growth Areas
-
Expansion into Asia-Pacific markets for refined and specialty sugars.
-
Value-added sugar products, such as organic or low-carbon certified sugar, are targeting sustainability-conscious buyers.
-
Increased use of re-export programs, allowing U.S. refineries to refine imported raw sugar and re-export refined products.
Strategic Takeaways
-
Exports are concentrated: Nearly 80% of U.S. sugar exports go to Mexico and Canada. Any disruption in those markets would have outsized effects.
-
Refined sugar is key: The U.S. export profile leans toward refined, high-quality sugar for industrial and consumer use.
-
Record production strengthens the export base: High output in 2024–25 gives producers flexibility to maintain or expand exports.
-
Global competitiveness remains limited: High production costs and strong domestic support prices restrict U.S. sugar competitiveness in broader global markets.
-
Stable but not explosive growth: The export business is stable, profitable, and regionally important, but unlikely to surge dramatically unless policy or trade costs shift.
Conclusion and Final Thoughts
The U.S. sugar export story in 2024–25 is one of steady growth, regional strength, and strategic balance. With exports worth over $3 billion, the U.S. sugar industry maintains a firm foothold in nearby markets while cautiously exploring global opportunities.
The overwhelming share of exports to Mexico and Canada underscores how regional integration drives trade more than global competitiveness. Yet, within that framework, the U.S. continues to carve out a role as a reliable, high-quality supplier of refined sugar. As production sets new records and global sugar markets remain tight, the outlook for 2025 is cautiously optimistic. U.S. sugar exports will likely stay within the 2.4–2.6 million metric ton range, small in the global context, but significant for domestic refiners, regional trade, and agricultural economics.
In short, while the U.S. will never rival Brazil or Thailand in sugar exports, it remains a steady, strategically important player in the North American and niche global sugar trade, a quiet but crucial part of the world’s sweet supply chain.
For more information on the latest US import-export data, or to search live data on US sugar exports by country, visit USImportdata. Contact us at info@tradeimex.in for customized trade reports, market insights, and a verified database of the top sugar exporters & suppliers in the USA, as per your needs.
Also read about:
What's Your Reaction?