US Apple Exports Data 2025: Database of US Apple Production & Apple Suppliers in USA
Discover US apple exports data with verified apple suppliers in USA and trusted apple exporters in USA. Analyze trade trends and grow your global reach.

The United States apple industry in 2026 stands at a turning point. Production is rising, exports are recovering, and global supply shifts are creating new opportunities. At the same time, domestic oversupply, shifting trade flows, and intensifying competition from other producing regions are reshaping the way apples move from American orchards to global markets. According to the latest US export data and Apple export data of the USA, the total value of US apple exports reached $1.06 billion in 2025, a 2% decline from the previous year. In 2025, the US apple exports totaled 857.71 thousand tons in quantity. The US exported apples worth $222.18 million in the first 2 months of 2026, as per the US apple export data under the HS code 080810.
The USA is the 2nd largest exporter of fresh apples in the world, according to global trade data. This article breaks down the latest data-driven insights on US apple production, exports, and supplier networks in 2025, with a practical look at how the industry operates and where it’s heading.
Overview of the US Apple Industry in 2025
The US is one of the world’s top apple producers, consistently ranking third globally behind China and the European Union. The US has a 6% global share in apple production with 5.03 million metric tons of apples produced in 2025-26.
Key 2025 highlights:
-
Total production (2025/26 forecast): 278–290 million bushels.
-
Total volume: 11.5–11.7 billion pounds.
-
Growth trend: +1% to +6% year-over-year, depending on the estimate.
This makes 2025 one of the largest apple harvests in recent US history, driven by improved yields, better orchard management, and favorable growing conditions. At the same time, the industry faces a paradox: more apples, but tougher market conditions, as per the report of the US Apple Export Council.
US Apple Exports by Country: Where Does the US Export Apples?
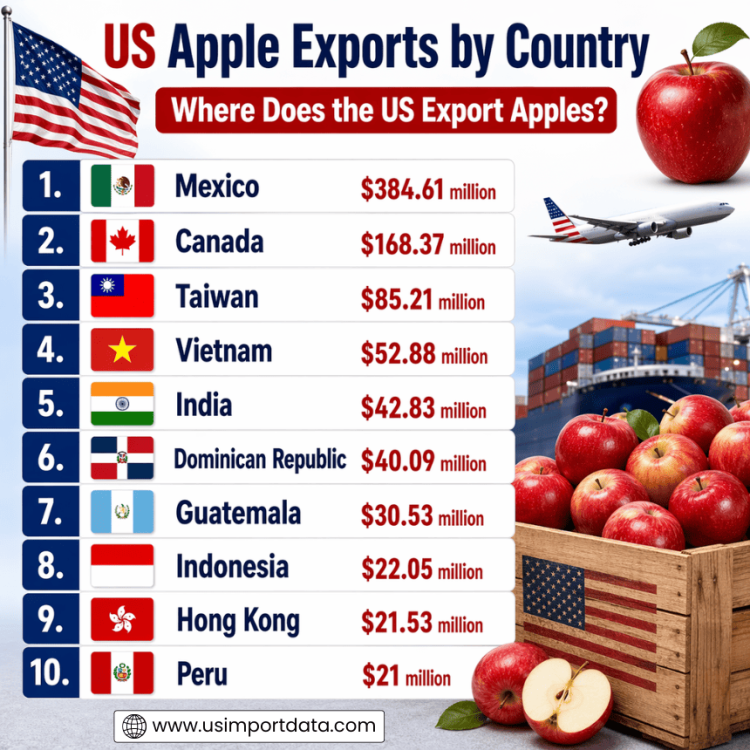
In examining US apple exports by country, it's evident that the United States has a widely diversified export market for apples. The top destinations for US apple exports include Canada, Mexico, India, Taiwan, and the United Arab Emirates, among others. These countries have consistently shown a strong demand for American apples, highlighting the global appeal and quality of US-grown produce. The top 10 destinations for US apple exports, as per the US fresh apples shipment data for 2025, include:
1. Mexico: $384.61 million (36%)
Mexico is the leading destination for US apple exports, accounting for a whopping 36% of the total export value, as per the data on US apple exports to Mexico by HS code. The proximity to the US and the high demand for fresh fruits make Mexico an ideal market for American apple growers. With a strong trade relationship between the two countries, it's no surprise that Mexico tops the list.
2. Canada: $168.37 million (15.8%)
Canada is another significant importer of US apples, making up 15.8% of the total export value. The neighboring country has a long history of trade with the US, and apples are no exception. Canadian consumers appreciate the quality and variety of American apples, making it a lucrative market for US exporters.
3. Taiwan: $85.21 million (8%)
Taiwan is a key player in the Asian apple market, accounting for 8% of US apple exports. The demand for high-quality apples in Taiwan has created opportunities for American growers to tap into this market. With a growing economy and a preference for US produce, Taiwan is a valuable export destination for US apple farmers.
4. Vietnam: $52.88 million (5%)
Vietnam has emerged as a promising market for US apple exports, representing 5% of the total export value. The improving economic conditions and changing consumer preferences in Vietnam have created a demand for fresh fruits, including apples. American growers have been able to capitalize on this trend and establish a presence in the Vietnamese market.
5. India: $42.83 million (4%)
India is a rapidly growing market for US apple exports, contributing 4% to the total export value. The increasing disposable income and changing dietary habits in India have led to a rise in demand for imported fruits, including apples. American growers have been able to leverage this opportunity and establish a foothold in the Indian market.
6. Dominican Republic: $40.09 million (3.8%)
The Dominican Republic is a key destination for US apple exports, accounting for 3.8% of the total export value, as per the data on US apple exports to the Dominican Republic. The proximity to the US and the demand for high-quality fruits in the Dominican Republic have created opportunities for American apple growers to expand their business in this market.
7. Guatemala: $30.53 million (2.9%)
Guatemala is a growing market for US apple exports, making up 2.9% of the total export value. The demand for fresh fruits and the increasing consumer awareness of the health benefits of apples have contributed to the growth of this market. American exporters have been able to meet this demand and establish a presence in Guatemala.
8. Indonesia: $22.05 million (2.1%)
Indonesia is an emerging market for US apple exports, representing 2.1% of the total export value. The growing middle class and the increasing urbanization in Indonesia have created a demand for imported fruits, including apples. American growers have recognized this potential and have been actively pursuing opportunities in the Indonesian market.
9. Hong Kong: $21.53 million (2%)
Hong Kong is a significant market for US apple exports, contributing 2% to the total export value. The strategic location of Hong Kong as a major trading hub in Asia has made it an attractive destination for American apple growers. With a strong demand for high-quality fruits, Hong Kong offers lucrative opportunities for US exporters.
10. Peru: $21 million (2%)
Peru is a growing market for US apple exports, making up 2% of the total export value. The increasing consumer awareness of the health benefits of apples and the demand for fresh fruits in Peru have created opportunities for American growers to expand their business in this market.
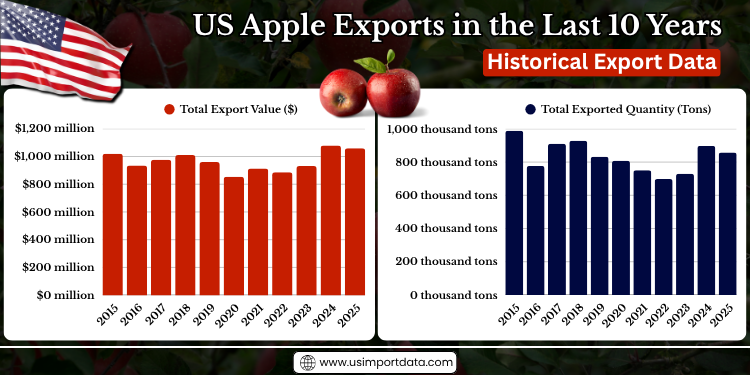
US Apple Exports in the Last 10 Years: Historical Export Data
|
Year of Exports |
Total Export Value ($) |
Total Exported Quantity (Tons) |
|
2015 |
$1.02 billion |
989.07 thousand tons |
|
2016 |
$935.49 million |
776.65 thousand tons |
|
2017 |
$977.36 million |
910.29 thousand tons |
|
2018 |
$1.01 billion |
927.76 thousand tons |
|
2019 |
$959.92 million |
832.42 thousand tons |
|
2020 |
$854.81 million |
807.52 thousand tons |
|
2021 |
$914.01 million |
750.36 thousand tons |
|
2022 |
$885.97 million |
697.92 thousand tons |
|
2023 |
$931.22 million |
730.11 thousand tons |
|
2024 |
$1.08 billion |
897.42 thousand tons |
|
2025 |
$1.06 billion |
857.71 thousand tons |

US Apple Exporters Database & Supply Chain: Top Apple Suppliers in USA
The US apple industry is structured around a network of:
-
Growers
-
Packers
-
Exporters
-
Distributors
Key Types of Apple Suppliers
1. Growers (Orchards)
These are the primary producers. Many are:
-
Family-owned farms
-
Cooperatives
-
Large agribusinesses
2. Packers & Shippers
They handle:
-
Sorting
-
Storage
-
Packaging
3. Export Companies
They connect the US supply with global buyers.
4. Processors
Used for:
-
Juice
-
Puree
-
Dried apples
Top Apple Exporting Companies in the USA
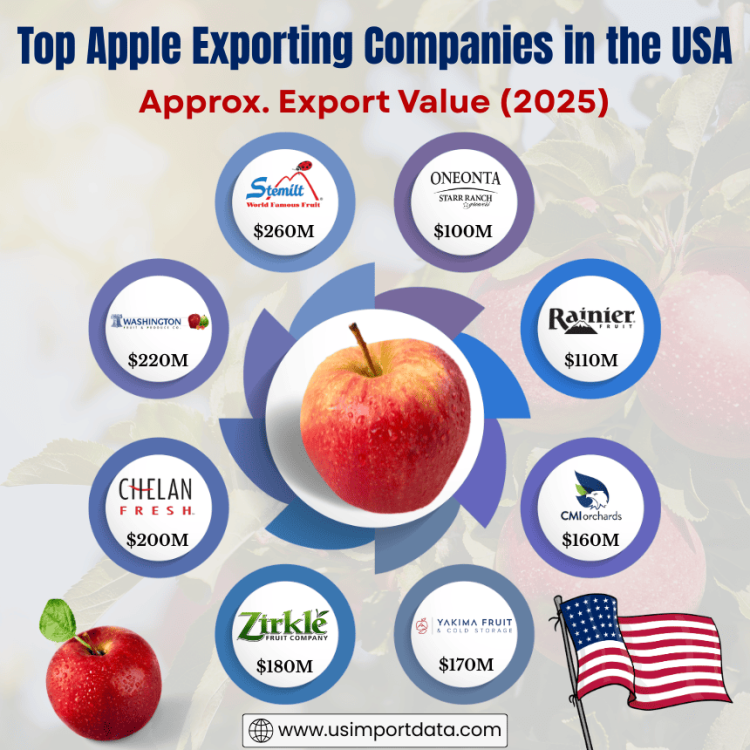
The leading apple suppliers in USA, as per the US apple exporters database & apple suppliers records for 2025, include:
1. Stemilt Growers LLC
-
Approx. export value: $260 million
-
Top apple types: Fuji, Gala, Honeycrisp, Granny Smith
-
Top export destinations: Canada, Mexico, India, Southeast Asia
2. Washington Fruit & Produce Co.
-
Approx. export value: $220 million
-
Top apple types: Gala, Red Delicious, Fuji
-
Top export destinations: Mexico, Taiwan, Vietnam
3. Chelan Fresh Marketing
-
Approx. export value: $200 million
-
Top apple types: Honeycrisp, Gala, Cosmic Crisp
-
Top export destinations: Canada, Mexico, South Korea
4. Zirkle Fruit Company
-
Approx. export value: $180 million
-
Top apple types: Gala, Fuji, Granny Smith
-
Top export destinations: Mexico, Southeast Asia
5. Yakima Fruit & Cold Storage
-
Approx. export value: $170 million
-
Top apple types: Red Delicious, Gala, Fuji
-
Top export destinations: India, Mexico, the Middle East
6. CMI Orchards LLC
-
Approx. export value: $160 million
-
Top apple types: Ambrosia, Fuji, Gala, Organic apples
-
Top export destinations: Canada, Asia, the Middle East
7. Rainier Fruit Company
-
Approx. export value: $110 million
-
Top apple types: Organic Gala, Honeycrisp, Fuji
-
Top export destinations: Canada, Europe, Asia
8. Oneonta Starr Ranch Growers
-
Approx. export value: $100 million
-
Top apple types: Gala, Fuji, Honeycrisp
-
Top export destinations: Mexico, Southeast Asia
9. Domex Superfresh Growers
-
Approx. export value: $90 million
-
Top apple types: Fuji, Gala, Honeycrisp
-
Top export destinations: Asia, Central America
10. Superfresh Growers
-
Approx. export value: $80 million
-
Top apple types: Gala, Fuji, Cosmic Crisp
-
Top export destinations: Canada, Vietnam, Indonesia
US Apple Production Data
1. Total Production Volume
The 2025 crop is widely described as a “wave of apples,” reflecting both scale and supply pressure, as per the US apple production data.
-
278.5 million bushels (USApple estimate)
-
290 million bushels (USDA-based estimate)
-
5.4 million metric tons equivalent
This marks:
-
3.6% above the 5-year average
-
Continued long-term growth driven by yield efficiency
2. State-Level Production Rankings
The US apple supply is heavily concentrated in a few states:
-
Washington: 8 billion lbs
-
New York: 1.45 billion lbs
-
Michigan: 1.1 billion lbs
-
Pennsylvania: 430 million lbs
-
Oregon & California: smaller but significant shares
Key insight:
Washington alone produces roughly two-thirds of all US apples.
3. Regional Production Dominance
The Pacific Northwest (PNW) dominates US apple production:
-
78% of fresh apple output comes from the region
-
70% of the total US apple production originates here
This includes:
-
Washington
-
Oregon
-
Idaho
The region’s climate, irrigation systems, and large-scale orchards make it the backbone of the US apple supply chain.
4. Acreage and Yield
-
Total US apple acreage: 299,500 acres
-
Pacific Northwest acreage: 178,600 acres
Yield improvements, not just acreage expansion, are driving growth. Modern orchards use:
-
High-density planting
-
Advanced irrigation
-
Precision agriculture
US Apple Export Data 2025
Export Volume Trends
After several years of decline, exports are rebounding.
-
2025 exports forecast: 890,000 metric tons
-
Growth: +6% year-over-year
However, the long-term trend shows volatility:
-
2015 exports: 47 million bushels
-
2022 exports: 27 million bushels (42%)
Recent recovery is linked to:
-
Reduced global supply
-
Improved US harvest size
-
Renewed demand in Asia
Export Value
-
Net export value: over $1 billion
Even with declining volumes in earlier years, the US maintained a positive trade balance in apples.
Global Market Position
-
US ranks third globally in production
-
Global apple exports: 6.1 million tons
-
US share: significant but not dominant
Key competitors:
-
China (the largest producer and exporter)
-
European Union
-
Turkey (volatile due to weather impacts)
Major Apple Supplier Regions in the USA
Washington State (Core Hub)
-
Produces 66% of the US apples
-
Dominates exports
-
Strong infrastructure for cold storage and trade
New York
-
Focus on fresh and processed apples
-
Strong domestic distribution
Michigan
-
Large processing apple base
-
Key supplier for juice and cider
Pennsylvania & California
-
Regional distribution and niche markets
Leading Apple Varieties Exported By the USA
Top commercial varieties include:
-
Gala
-
Red Delicious
-
Fuji
-
Granny Smith
-
Honeycrisp
These are selected based on:
-
Shelf life
-
Export durability
-
Consumer demand
Database Structure: US Apple Production & Suppliers
If you’re building or analyzing a US apple supplier database, here’s how it’s typically structured:
|
Field |
Description |
|
Supplier ID |
Unique identifier |
|
Company Name |
Orchard/packer/exporter |
|
HS Code |
080810 |
|
Product Description |
Fresh Apples |
|
State |
Production region |
|
Annual Production |
Volume in bushels or tons |
|
Apple Varieties |
Gala, Fuji, etc. |
|
Export Markets |
Countries served |
|
Certifications |
Organic, USDA, etc. |
Key Trends in US Apple Exports
1. Oversupply Pressure
A record crop is creating pricing challenges:
-
Excess supply is depressing market prices
-
Farmers face shrinking margins
This makes exports even more critical.
2. Shift Toward Export Growth
With domestic markets saturated:
-
Export expansion is essential
-
New markets in Asia are strategic targets
3. Rising Competition
Global dynamics are shifting:
-
China dominates production
-
EU maintains strong export presence
-
Weather disruptions (e.g., Turkey frost) create short-term opportunities
4. Technology & Storage Innovation
Modern infrastructure enables:
-
Longer storage periods
-
Year-round supply
-
Better export quality
This is a major advantage for US suppliers.
Challenges Facing the US Apple Industry
1. Declining Export Share (Long-Term)
Even with the recent recovery:
-
The export share dropped from 30% to 20% historically
2. Price Volatility
Large harvests result in lower prices. Smaller harvests result in higher prices. This cycle affects profitability.
3. Labor & Cost Pressures
-
Rising labor costs
-
Increased transportation expenses
-
Regulatory compliance
4. Climate Risks
Weather variability impacts:
-
Yield
-
Fruit quality
-
Harvest timing
Opportunities for Growth
Expansion in Asian Markets
High-potential markets:
-
India
-
Vietnam
-
Thailand
Driven by:
-
Rising middle class
-
Increased fruit consumption
Organic Apple Growth
-
Washington produces over 90% of the US organic apples
-
Strong demand in premium markets
Value-Added Products
Beyond fresh apples:
-
Apple juice
-
Cider
-
Dried apples
These help stabilize revenue streams.
Future Outlook (2026–2030)
The US apple industry is expected to evolve in several ways:
1. Increased Export Focus
Exports will remain critical for balancing supply.
2. Consolidation of Suppliers
Larger operations will dominate due to scale advantages.
3. Data-Driven Agriculture
Use of:
-
AI
-
Precision farming
-
Yield analytics
4. Sustainability Push
-
Water efficiency
-
Reduced chemical use
-
Organic expansion
Conclusion and Final Thoughts
In conclusion, the US apple industry in 2026 is defined by scale, efficiency, and transition.
-
Production is at near-record levels
-
Exports are recovering but remain below historical peaks
-
Supplier networks are highly concentrated in the Pacific Northwest
-
Global competition and domestic oversupply are reshaping strategy
For businesses, importers, and analysts, the key takeaway is clear: Success in the US apple market increasingly depends on data, production metrics, export trends, & supplier intelligence. A well-structured database of US apple production & suppliers is no longer optional. It’s essential for navigating a complex, high-volume, and globally competitive industry.
Note For Our Readers
We hope you found this blog on US apple exports data for 2025, production insights, and the US apple suppliers & exporters database useful in understanding how the global apple market is evolving. With rising production volumes, shifting export demand, increasing competition from global producers, and growing preference for premium and organic apple varieties, staying informed with accurate and reliable trade data is essential for making smart sourcing and business decisions.
If you’re looking for deeper insights, customized US import-export data, or want to explore live US apple export data by country, company, or HS code, feel free to connect with USImportdata. We provide comprehensive and up-to-date US trade databases to support your research and business needs. For exclusive access or tailored data solutions, contact us at info@tradeimex.in today and move forward with clarity and confidence.
What's Your Reaction?