US Ceramic Tiles Imports Report 2025: USA Ceramic Tiles Importer Data & HS Code 6907 Import Records
Explore US ceramic tiles imports data 2025, including top ceramic tiles buyers, ceramic tiles importers in USA, & detailed US ceramic tile import insights.
Ceramic tiles remain a cornerstone of the construction and home improvement markets in the United States. They’re essential for residential flooring, commercial installations, and architectural finishes. In 2025, the U.S. continues to be one of the largest global importers of ceramic tiles, driven by strong domestic demand, limited local production, and the performance advantages of global suppliers. According to the latest US import data and Ceramic Tiles import data of the USA, the total value of US ceramic tiles imports reached $2.27 billion in 2024, a 4% decline from the previous year. According to the US ceramic tiles import data by HS code 6907, the US imported ceramic tiles worth $2.14 billion in 2025, a 1% decline from the previous year. The US ceramic tile market is heavily driven by imports, with total consumption reaching around 2.7 billion square feet in 2024, of which imports accounted for over 70% of demand.
The USA is the largest importer of ceramic tiles in the world, as per the global trade data. This report breaks down the latest import volumes, key source markets, importer activities, HS code data (specifically HS 6907), and broader market trends for 2025 to help analysts, importers, and manufacturers gain a clear picture of the US ceramic tiles trade.
Why the US Ceramic Tiles Market Depends on Imports
Ceramic tiles are classified under several Harmonized System (HS) codes, with HS 6907 covering most ceramic tile categories, including:
-
Ceramic flags and paving tiles
-
Hearth or wall tiles
-
Other ceramic wall and floor tiles (with various absorption and material criteria)
These products have high demand in construction and refurbishment, but relatively limited domestic production compared to the volume consumed, leading to massive imports year-after-year.
According to the latest US import data, the U.S. imported over $2.1 billion worth of ceramic tiles under HS 6907 related categories in 2025, which is equivalent to more than 108 million square meters of ceramic tile area.
Overall U.S. Ceramic Tile Import Trends in 2025
Import Volume & Share in Market Consumption
In the first quarter (Q1) of 2025:
-
The U.S. imported about 476.8 million square feet of ceramic tiles, a 11.5% increase compared to Q1 2024.
-
Imports accounted for 73.2% of total U.S. tile consumption in Q1, up from 68.7% in Q1 2024, as per the US ceramic tile Q1 2025 market update.
-
This indicates that imported tiles are not just present; they dominate the market.
This trend reflects broader market fundamentals:
-
Domestic tile manufacturing has plateaued, while construction and renovation activity rebounds post-pandemic.
-
Imported products often offer competitive pricing, specialized styles, and superior performance characteristics (e.g., porcelain tiles with low water absorption).
Import Value Trends
On a value basis, tile imports also grew in 2025:
-
Total import value (CIF + duty) in Q1 2025 reached over $604 million, up 10.7% year-on-year.
-
Spain and Italy accounted for the majority of this import value, further underlining European strength in premium tile exports.
US Ceramic Tiles Imports by Country: Where Does the US Import Ceramic Tiles From?
The United States imports ceramic tiles from various countries globally to meet the demand for this essential building material. Some of the primary sources of US ceramic tile imports include Italy, China, Mexico, Spain, and Turkey. These countries are known for their high-quality ceramic tile production and diverse designs, allowing US consumers to have access to a wide range of options for their residential and commercial projects. This highlights the strong role of importing tiles to USA, as the country relies on global suppliers such as India, Spain, Italy, and Mexico to meet construction and renovation needs. As one of the largest ceramic tiles importing countries, the United States continues to source tiles from key international markets, making global trade data essential for identifying suppliers, tracking trends, and understanding competitive dynamics in the tile industry.
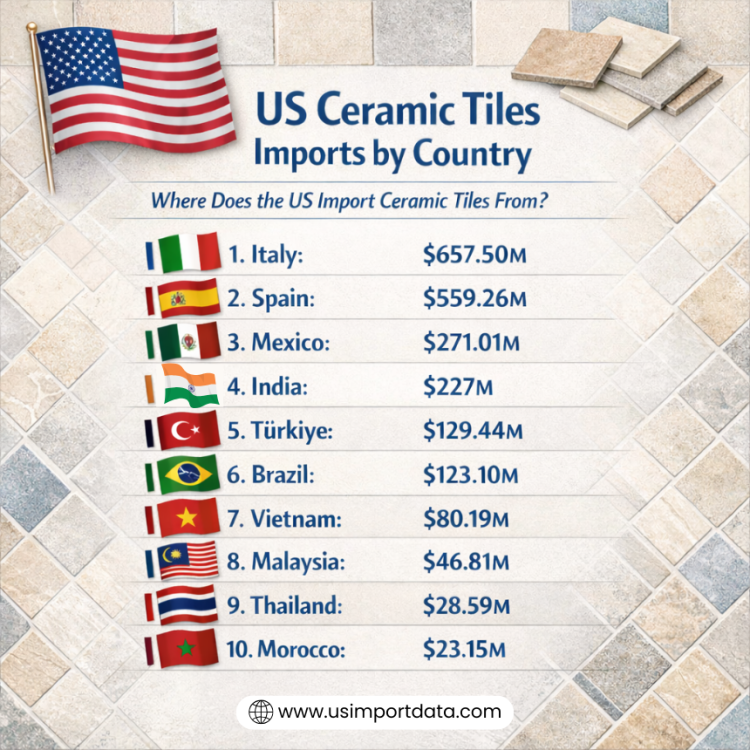
Ceramic tiles are a popular choice for both residential and commercial spaces in the United States. With a wide variety of designs, colors, and sizes available, ceramic tiles offer versatility and durability. The top 10 supplier countries of ceramic tiles to the USA, as per the US ceramic tiles imports by country and US import shipment data for 2025, include:
1. Italy: $657.50 million (28.9%)
Italy is the largest exporter of ceramic tiles to the US, accounting for nearly 30% of the total imports, as per the data on US ceramic tiles imports from Italy by HS code. Italian ceramic tiles are known for their quality craftsmanship, elegant designs, and premium finishes. From classic marble-look tiles to contemporary patterns, Italy offers a wide range of options for every style and budget.
2. Spain: $559.26 million (24.6%)
Spain is another prominent player in the ceramic tile industry, supplying over a quarter of the US imports. Spanish ceramic tiles are characterized by their bold colors, intricate patterns, and innovative designs. Whether you're looking for traditional Terracotta tiles or modern geometric patterns, Spain has something for everyone.
3. Mexico: $271.01 million (11.9%)
Mexico is a leading supplier of ceramic tiles to the US market, offering a diverse selection of tiles at competitive prices. Mexican ceramic tiles are known for their vibrant colors, rustic charm, and handcrafted appeal. Whether you're looking for Talavera tiles or Saltillo tiles, Mexico has a wide range of options to choose from.
4. India: $227 million (10%)
India is gaining popularity as a source of ceramic tiles due to its affordable pricing and unique designs. Indian ceramic tiles are known for their intricate patterns, vibrant colors, and cultural motifs. From floral prints to geometric shapes, India offers a wide range of options for those looking to add a touch of exotic flair to their spaces.
5. Türkiye: $129.44 million (5.7%)
Turkey is a major exporter of ceramic tiles to the US, known for its high-quality products and competitive pricing. Turkish ceramic tiles are characterized by their rich colors, intricate patterns, and elegant finishes. Whether you're looking for traditional Ottoman designs or modern minimalist styles, Turkey has something for every taste.
6. Brazil: $123.10 million (5.4%)
Brazil is a rising star in the ceramic tile industry, offering a unique blend of traditional craftsmanship and contemporary designs to the USA, as per the data on US ceramic tiles imports from Brazil. Brazilian ceramic tiles are known for their natural textures, earthy tones, and eco-friendly materials. Whether you're looking for natural stone-look tiles or wood-look tiles, Brazil has a diverse selection to choose from.
7. Vietnam: $80.19 million (3.5%)
Vietnam is becoming an increasingly popular source of ceramic tiles for the US market, thanks to its affordable pricing and modern designs. Vietnamese ceramic tiles are known for their sleek finishes, minimalist aesthetics, and trendy patterns. Whether you're looking for subway tiles or hexagonal tiles, Vietnam has a range of options to suit your style.
8. Malaysia: $46.81 million (2.1%)
Malaysia is a lesser-known player in the ceramic tile industry but offers a unique range of tiles with a focus on quality and innovation. Malaysian ceramic tiles are known for their durability, easy maintenance, and contemporary designs. Whether you're looking for polished tiles or textured tiles, Malaysia has options to cater to your needs.
9. Thailand: $28.59 million (1.3%)
Thailand may be a small player in the ceramic tile market, but it offers a selection of tiles that combine traditional craftsmanship with modern aesthetics. Thai ceramic tiles are known for their intricate details, soothing colors, and affordable pricing. Whether you're looking for mosaic tiles or large format tiles, Thailand has options to enhance your space.
10. Morocco: $23.15 million (1%)
Morocco is known for its rich heritage and vibrant culture, which is reflected in its ceramic tiles. Moroccan tiles are characterized by their intricate patterns, vibrant colors, and hand-painted motifs. Whether you're looking for Zellige tiles or encaustic tiles, Morocco offers a touch of exotic elegance to any space.
Notably Declining Markets
India, traditionally a significant supplier in previous years, saw a notable drop in export volume to the U.S. in 2025, declining by more than 25% compared to 2024, likely due to changes in global shipping costs and competitive pressures from Europe and Latin America.
USA Ceramic Tiles Importers Database: Top Importers & Shipment Records
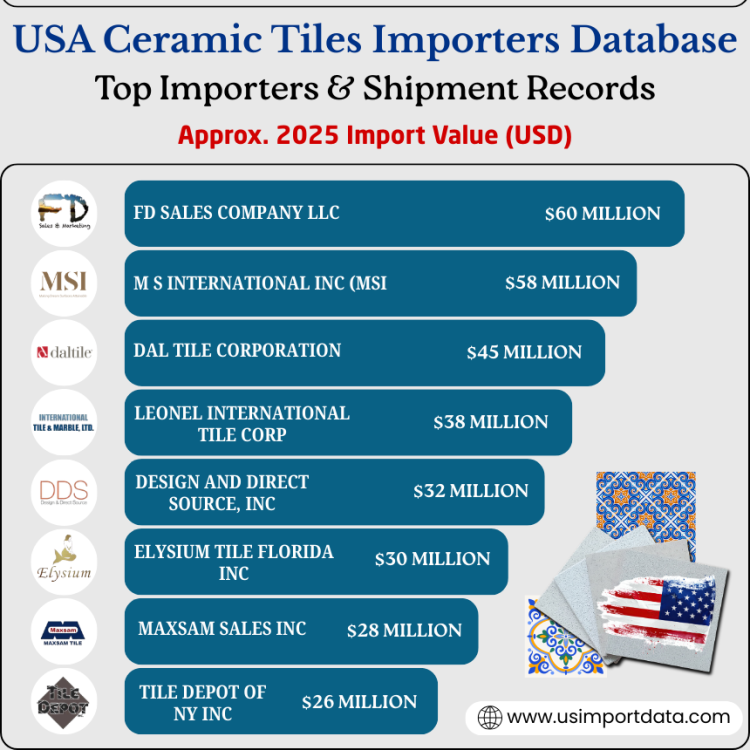
The USA Ceramic Tiles Importers Database provides valuable insights into the top importers and detailed shipment records within the ceramic tiles industry. This comprehensive resource provides essential information for businesses seeking to understand market trends, identify key players, and make informed decisions in the import-export sector. The leading ceramic tiles buyers & importers in the USA, as per the US ceramic tiles importer data for 2025, include:
|
Rank |
Company |
Approx. 2025 Import Value (USD) |
Top Imported Tile Types |
Top Import Source Countries |
|
1 |
FD Sales Company LLC |
$60 million |
Ceramic floor & wall tiles (HS 690721) |
Spain, Turkey, Vietnam |
|
2 |
M S International Inc (MSI) |
$58 million |
Porcelain and ceramic tiles |
Italy, Spain, India |
|
3 |
$45 million |
Glazed ceramic wall/floor |
Italy, Spain |
|
|
4 |
Leonel International Tile Corp |
$38 million |
Ceramic tiles (690721/690723) |
Spain, Mexico |
|
5 |
Design and Direct Source, Inc. |
$32 million |
Glazed ceramic tiles |
Spain, Italy |
|
6 |
Elysium Tile Florida Inc |
$30 million |
Ceramic wall and floor tiles |
Spain, India |
|
7 |
Maxsam Sales Inc |
$28 million |
Flags & paving/ceramic tiles |
Italy, Mexico |
|
8 |
Tile Depot of NY Inc |
$26 million |
Ceramic tiles (690721) |
Spain, Brazil |
|
9 |
De Marco Tile |
$24 million |
Ceramic wall & floor tiles |
Spain, Mexico |
|
10 |
Concept Surfaces |
$22 million |
Wall/floor ceramic tiles |
Spain |
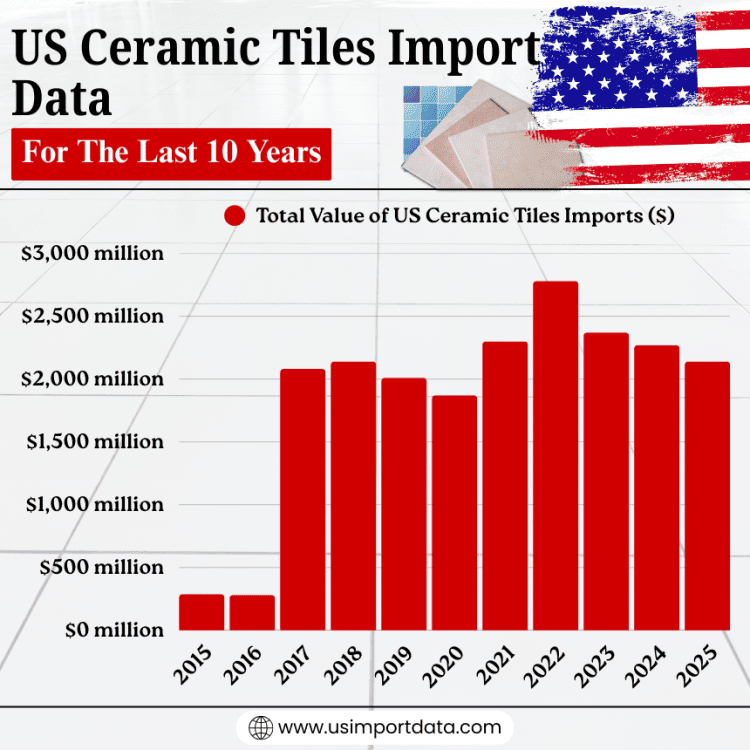
US Ceramic Tiles Import Data For The Last 10 Years
|
Year of Imports |
Total Value of US Ceramic Tiles Imports ($) |
|
2015 |
$288.93 million |
|
2016 |
$281.71 million |
|
2017 |
$2.08 billion |
|
2018 |
$2.14 billion |
|
2019 |
$2.01 billion |
|
2020 |
$1.87 billion |
|
2021 |
$2.30 billion |
|
2022 |
$2.78 billion |
|
2023 |
$2.37 billion |
|
2024 |
$2.27 billion |
|
2025 |
$2.14 billion |

HS Code 6907: The Heart of US Ceramic Tiles Import Data
The HS 6907 series encompasses the bulk of ceramic tile imports. It includes multiple subheadings, such as:
-
6907.21: Ceramic tiles with low absorption (polished or glazed).
-
6907.23: Other ceramic tiles.
-
6907.30/.40: Other categories with higher absorption or specialized usage.
The latest shipment data shows large activity under these codes, connecting import shipment records to actual businesses receiving products in the U.S. For instance:
-
U.S. buyers such as STANDARD TILE and HIGH STYLE FLOORS INC appear in multiple 6907 import records, receiving shipments from Spanish and Italian suppliers at ports like New York/Newark and Houston.
Recent 2025 US Ceramic Tiles Shipment Data Examples Under HS 6907
|
Date |
HS Code |
Country of Origin |
Imported By |
Port |
|
21-Aug-2025 |
690721/690723 |
Spain/Italy |
DESIGN AND DIRECT SOURCE LLC |
New York, NY |
|
21-Aug-2025 |
690721 |
Italy |
HIGH STYLE FLOORS INC |
New York, NY |
|
08-Aug-2025 |
690721 |
Spain |
EQUIPE CERÁMICAS SL |
New York/Newark |
These detailed shipment records give a granular snapshot of real-world trade and through which U.S. gateways.
Importers & Buying Entities in the U.S.
While individual trade data is extensive, several buyers recur frequently in the 2025 US import records:
Active Ceramic Tiles Importers & Buyers in 2025
Some of the consistent names in HS 6907 tile shipments include:
-
Standard Tile: A major recipient of large consignments from Spanish exporters under HS codes 690721 and 690723.
-
High Style Floors Inc: Receives a range of tile types from Italy and Spain.
-
Concept Surfaces: Another importer handling tiles from Spain across multiple shipment dates.
These companies reflect the diverse U.S. landscape of import buyers, from larger national distributors to regional flooring specialists.
Market Patterns & Growth Indicators (2025)
Volume Vs. Value Comparison
While volume showed double-digit gains in Q1 2025, value growth was slightly more moderate, indicating stable or declining unit pricing for many imported tiles due to competitive pressures, market saturation, and currency effects.
Shifting Country Shares
European suppliers (especially Spain and Italy) have increased their share on both value and volume fronts, while some Asian suppliers, notably India, lagged in 2025. This may be due to shipping cost fluctuations, currency moves, or buyers shifting toward European and Latin American sources.
Spain’s share by value, at nearly 29% of total U.S. ceramic tile import value, illustrates the premium pricing of European imports. Italy’s share was close behind.
Strategic Import Practices
Some indicators for 2025:
-
Just-in-time shipments dominate, with multiple weekly consignments from major ports like New York/Newark and Houston.
-
Fragmented buyer landscape, with thousands of U.S. importers and distributors, but a concentration of the highest volumes among the top handful.
-
HS 6907 continuity remains strong as the primary classification for ceramic tile imports, essential for customs compliance and tariff calculations.
Practical Use of Import Data for Businesses
Companies involved in the ceramic tile trade can use US import data in the following ways:
1. Supplier Benchmarking
Trade records help identify which suppliers are actively shipping to the U.S. and at what frequency, essential for sourcing strategies.
2. Buyer Targeting
Buyers can discover potential competitors or partners by analyzing shipments tagged with specific HS codes and importing entities.
3. Customs & HS Code Compliance
Understanding how products are classified (e.g., 690721 vs. 690723) informs correct duty declarations, tariff planning, & compliance with U.S. Customs & Border Protection.
4. Market Forecasting
Volume and value trends, such as the Q1 2025 uptick, give early signals for growth or contraction cycles in tile demand.
Key Takeaways: U.S. Ceramic Tile Imports in 2025
Here’s what the numbers and records tell us:
-
The U.S. continues to be a major ceramic tile importer, with imports surpassing domestic production by a wide margin.
-
HS code 6907 captures the majority of the ceramic tile trade, making it a focal point for import analysis and tariff planning.
-
Spain and Italy lead in supply volumes and values, showcasing strong competitive positions.
-
India’s export share dipped in 2025, signaling shifting global supply dynamics.
-
Detailed shipment records help segment real importers in the market, from large distributors to regional buyers.
Conclusion and Final Thoughts
In conclusion, the 2025 US Ceramic Tiles Imports Report underscores the continuing importance of cross-border supply for the American tile market. Ceramic tiles, under the critical HS code 6907 categories, remain a fundamental part of the U.S. construction and flooring cost structure. With robust import volumes and diversified supplier sources, the U.S. market is both resilient and highly competitive. For stakeholders, whether importers, suppliers, analysts, or market planners, understanding the rhythm of imports, key players, and tariff classifications is essential for strategic positioning in 2025 and beyond.
Want to access the latest US export-import data or search live data on US ceramic tiles imports by country? Visit USImportdata and get a verified US ceramic tiles importers & buyers database. Contact us at info@tradeimex.in for customized trade reports and market insights.
What's Your Reaction?