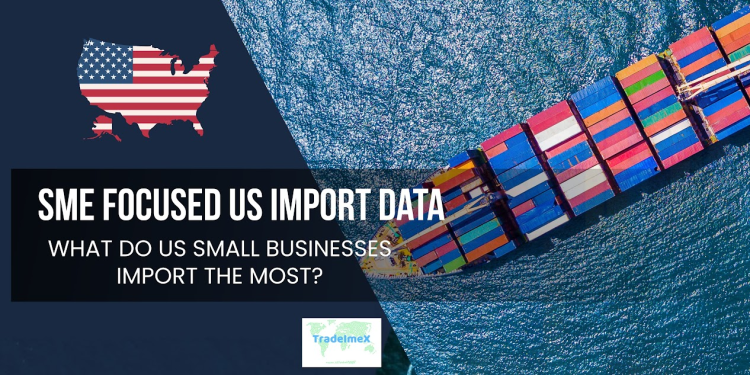
SME-Focused US Import Data: What Do US Small Businesses Import the Most?
Discover what US small businesses import the most in 2025. Explore SME-focused US import data & top products to help SMEs make informed sourcing decisions.
In today's global economy, small and medium-sized enterprises (SMEs) play a crucial role in driving economic growth and creating job opportunities. Information regarding the import operations of small and medium-sized enterprises (SMEs) in the US is the main emphasis of SME-focused US import data. Businesses can use this information to find possible suppliers and buyers, comprehend market trends, and make well-informed decisions regarding international trade. The total value of US imports reached $3.35 trillion in 2024, as per the US import statistics, with SMEs playing a huge role. As these businesses continue to expand their operations and reach overseas markets, it's important to understand what they are importing from other countries. In this article, we will explore the latest data on US small business imports and analyze what the US SMEs import the most.
Companies importing machinery to USA often rely on detailed market insights to identify growth opportunities. Access to an SMEs database provides valuable information on potential partners, suppliers, and competitors, helping businesses make informed decisions. For smaller enterprises, a small business database is essential for networking, sourcing leads, and expanding operations within the competitive U.S. market.
Understanding US Small Business Imports
Small businesses in the United States rely on imports for a variety of reasons, including accessing high-quality products at competitive prices, sourcing raw materials for production, and meeting consumer demand for a diverse range of goods. According to the US International Trade Commission, SMEs accounted for over 97% of all US importers and 32% of total US import value in 2024.
Top Imports for US Small Businesses
-
Electronics: Electronic products such as smartphones, computers, and consumer electronics are among the most imported items by US small businesses, as per the US electronics import data. With the rapid advancements in technology, SMEs rely on importing electronic goods to stay competitive in the market.
-
Apparel and Textiles: Clothing and textile products are another popular import category for US SMEs, as per the textile import data of USA. With the rise of fast fashion and e-commerce, small businesses import a wide range of apparel items to cater to consumer preferences.
-
Machinery and Equipment: Machinery and equipment imports are essential for US small businesses across various industries, including manufacturing, construction, and agriculture. SMEs often import specialized machinery to improve operational efficiency and optimize production processes.
-
Food and Beverages: The food and beverage industry is a significant importer for US small businesses, with a growing demand for international cuisine and specialty products. From exotic spices to gourmet chocolates, SMEs import a diverse range of food items to meet consumer cravings.
-
Automotive Parts: Automotive parts and accessories are in high demand among US small businesses, especially those in the automotive repair and maintenance sector. Importing quality auto parts allows SMEs to offer a comprehensive range of services to their customers.
Who Are the Importing US Small Businesses?
-
SMBs dominate U.S. imports by count: Small and medium enterprises (firms with fewer than 250 employees) represent about 96–97% of U.S. importers, accounting for 32% of total import value.
-
Value vs. volume: While SMBs make up nearly all importers, their share of the total value is proportionally smaller (32%), meaning large corporations often secure high-value, bulk imports.
-
Sector prevalence: In manufacturing and wholesale sectors, small businesses formed 94%–99% of importers, contributing meaningfully to $602 billion and $451 billion in those areas.
Top 10 Products Imported by US Small Businesses in 2024-25
The top 10 products imported by US small businesses showcase a diverse range of goods catering to various consumer needs and industry demands. From electronic devices like smartphones and laptops to apparel, pharmaceuticals, and machinery, these imports highlight the interconnected global market that small businesses actively contribute to. The top 10 US imports by the small US businesses or SMEs, as per the US import data and US shipment data for 2024-25, are:
1. Industrial Machinery (including computers): $531 billion
-
HS 84: Nuclear reactors, boilers, machinery (including computers) led imports with $531.2 billion (15.8% of total), as per the US machinery imports by HS code.
-
SMEs in manufacturing, tech startups, repair services, etc., make up a large portion of this group, importing components, tools, and equipment for operations.
2. Electrical Machinery & Equipment: $485 billion
-
HS 85: Electrical machinery & equipment imports totaled $485.9 billion (14.5%).
-
Includes computers, cables, motors, and power units. SMEs such as electronics resellers, repair shops, and small tech manufacturers depend heavily on these imports.
3. Vehicles & Automotive Parts: $391 billion
-
HS 87: Vehicles & parts reached $391.5 billion (11.7%).
-
SMEs in auto repair, customization, and parts retail account for substantial import volumes, particularly for niche or aftermarket components.
4. Mineral Fuels & Oils: $251 billion
-
HS 27: Crude oil and related products imported $251.1 billion (7.5%).
-
Small distribution firms, specialty fuel services, and small industrial users drive this demand.
5. Pharmaceutical Products: $212 billion
-
HS 30: Pharmaceuticals imports totaled $212.7 billion (6.3%).
-
Independent pharmacies, compounding labs, and clinics rely on imports for a broad range of medications and niche compounds.
6. Optical, Medical & Scientific Equipment: $124 billion
-
HS 90: Optical, medical, and scientific instruments brought in $124 billion (3.7%).
-
SMEs such as dental clinics, veterinary practices, and lab equipment suppliers fall into this category.
7. Precious Stones & Metals: $89 billion
-
HS 71: Gems and precious metals imports valued $89.7–97 billion.
-
Jewelry designers and specialty small retailers rely on these imports to offer unique, high-value pieces.
8. Plastics & Plastic Articles: $78 billion
-
HS 39: Plastic materials and finished goods totaled $78.2–89.9 billion.
-
SMEs in packaging, small-batch production, and 3D printing sectors import plastics for various applications.
9. Furniture & Home Goods: $72 billion
-
HS 94: Furniture, bedding, home furnishings around $72.6 billion (2.2%).
-
SMEs in retail, home décor, and custom interiors import goods to compete on design and price.
10. Organic Chemicals: $71 billion
-
HS 29: Organic chemicals ($71.05 billion) contribute another significant chunk.
-
SMEs in specialty chemicals, agriculture, fragrance, and food ingredients depend on imported chemicals to operate.
Summary
|
Rank |
Product Category |
Total U.S. Import Value (2024) |
|
1 |
Industrial Machinery (incl. computers) |
$531 billion |
|
2 |
Electrical Machinery |
$485 billion |
|
3 |
Vehicles & Automotive Parts |
$391 billion |
|
4 |
Mineral Fuels & Oils |
$251 billion |
|
5 |
Pharmaceuticals |
$213 billion |
|
6 |
Optical/Medical/Scientific Equipment |
$124 billion |
|
7 |
Precious stones and metals |
$90 billion |
|
8 |
Plastics & Plastic Articles |
$78 billion |
|
9 |
Furniture and bedding |
$72 billion |
|
10 |
Organic Chemicals |
$71 billion |
Why This Matters for US SMEs
-
Sector Alignment: These categories reflect core SME activities, manufacturing, retail, repair, and professional services.
-
Margin Pressure: Tariffs and supply chain interruptions hit SMEs hardest, especially when sourcing from China or under de minimis thresholds.
-
Opportunity & Risk: Diversifying supplier countries and optimizing freight can help SMEs manage costs and gain reliability.
-
Policy Levers: Targeted tariff relief (e.g., de minimis exemption, small-business carve-outs) would disproportionately benefit SMEs in these categories.
Next Steps for SME Importers in the US
-
Benchmark & Analyze: Compare your company’s importing mix with top categories. Are you aligned or heavily dependent on volatile goods?
-
Supplier Diversification: Look beyond China; Mexico, India, and Vietnam are key emerging alternatives.
-
Use De Minimis Wisely: Keep imports under $800 where possible to skip duties, but note policy changes post-May 2, 2025.
-
Plan for Tariff Volatility: Be agile, hedge with flexible contracts and inventory buffers.
-
Advocate: Join trade associations to push for SME-specific import relief.
These figures reflect total U.S. imports, but SMEs comprise 96–97% of importers by count, and roughly 32% of import value, meaning their footprint across these categories is substantial, even if overshadowed by big corporations in absolute dollar terms.
Top 10 U.S. SMEs in 2025
1. Confero, Inc. (Top Business 2024-25)

Confero Inc., a customer service research and mystery-shopping firm founded in 1986. Recognized as the overall CO—100 honoree for its perseverance and innovation.
2. 787 Coffee (Growth Accelerator)

Based in New York, 787 Coffee expanded from a single Roastery to 25 locations across Puerto Rico, Texas, and New York by focusing on sustainable sourcing and community integration.
3. Aquantuo (Global Star)

A leading import company headquartered in Dover, Delaware, that's enabling African businesses and individuals to access global goods markets.
4. Underground Printing

A custom apparel business from Michigan, scaling from a garage startup to 30 retail locations and $25–50 million in revenue, while making social-impact statements during COVID and beyond.
5. Bookminders

A Pittsburgh-based bookkeeping firm founded in 1991. With ~85 employees, it combines professional financial services and a nationally recognized home-based "cottage corporation" model.
6. Saltchuk

A major Seattle logistics and distribution firm, family-owned and generating $4.8 billion in 2024, with thousands of employees and a strong regional footprint.
7. Camino Financial

A 2014-founded fintech startup that helps small businesses find loan options and improve credit via an AI-driven lending marketplace.
8. Sigma Computing

A data analytics/cloud dashboard provider recognized among the best small employers in 2024, praised for enabling users across industries to work smarter and faster.
9. Genesis 10

An IT & business staffing firm with deep roots (Y2K era) and expertise in delivering talent across permanent, contract, and SOW models—celebrated in top workplace lists.
10. Allstate Sales Group

Ranked as a top small-sized employer (200–999 staff, $100 m–$1 b revenue) by Newsweek in their “America’s Greatest Workplaces 2024” list.
Top Imported Categories in the US by SMBs
SMB import patterns broadly mirror U.S. national trends but with niche tilts. Here's a breakdown:
A. Capital Goods & Electronics
-
Overall U.S. imports:
-
Capital goods (ex‑auto): $646 billion–$678 billion annually.
-
Computers & related: ~$131 billion
-
Telecommunications, semiconductors: ~$117 billion
-
SMB role:
-
Import computers, printers, semiconductors, and industrial machinery, either for resale, use in manufacturing, or tech startups sourcing components.
-
Data from the Census’s TIPS suggests explosive lithium-ion battery imports ($18.6 billion in 2023), with significant volumes destined for smaller manufacturers and EV component makers.
B. Consumer Goods & Textiles
-
Consumer goods: $654 billion total imports, led by pharma ($149 billion), electronics, apparel & footwear ($130 billion).
-
Textiles/apparel: SMBs account for 95% of textile importers, engaging heavily in apparel, footwear, and home décor imports.
C. Industrial Supplies & Fuels
-
Total imports: $522 billion, industrial supplies (crude oil & petroleum $191 billion).
-
SMBs often import specialized chemical feedstocks, oils, and lubricants, integral to manufacturing processes.
D. Vehicle Parts & Accessories
-
Vehicles & parts: 11–12% of imports ($391 billion).
-
Small businesses import aftermarket parts, accessories, and niche vehicle components (e.g., classic car parts).
E. Pharmaceuticals & Medical Equipment
-
Pharma: $212 billion in imports; medical instruments: $124 billion.
-
SMBs include pharmacies, health-care start-ups, clinics sourcing niche meds and instruments.
SMB-Focused Import Categories: Top 5 Products
Based on the sectors where small firms drive import activity:
|
Top Categories for SMBs |
Why It Matters |
Data Snapshot |
|
1. Electronics & Components |
Vital for tech-adjacent SMBs (repair, startups) |
Capital goods >$646 billion; computers & semis = $248 billion |
|
2. Apparel, Textiles & Footwear |
Dominant in import penetration |
SMBs account for 95% of textile importers |
|
3. Industrial Machinery & Supplies |
Crucial for small-scale manufacturers |
Machinery & industrial engines ~ $522 billion; small biz heavy |
|
4. Auto Parts & Accessories |
Aftermarket parts niche |
Vehicles & parts $391 billion; SMBs supply aftermarket |
|
5. Medical & Pharmaceutical Goods |
Clinics & health SMBs rely on imports |
Pharma and instruments $336 billion |
Tariff Shock & Real-World Impact
SMBs often lack budget buffers, making them sensitive to trade policy shifts:
-
Tariff pain:
The US SMBs, especially those importing from China, are experiencing distress under current tariff rates (up to 145%), impacting toys, apparel, coffee, outdoor gear, and medical supplies. -
Business casualties:
Nearly one‑third of U.S. imports ($868 billion) come from small and midsize firms. Up to 80% face bankruptcy risk due to surging duties. -
Cross‑sector strain:
From fireworks and décor to coffee and furniture, SMBs across sectors depend on imports.
Where They Import From & How Much
-
Country of origin:
Top import partners for the U.S. include China, Canada, Mexico, Japan, and Germany.
17% of capital goods imports come from China, as per the data on US imports from China, and another 17% from Mexico; 28% of consumer goods from China, and auto parts from Mexico (38%). -
Channel dynamics:
SMBs frequently use sea freight to optimize costs, especially for textiles, machinery, and bulk goods. De minimis exemptions ($800 threshold) ease small-item import burdens.
Why It Matters for the Economy
-
Economic diversity: SMBs generate employment and add product diversity: 32% of U.S. import value flows through small firms.
-
Innovation & resilience: Many imported niche, high-value items—EV batteries, specialty textiles, medical tools. These are often unavailable domestically.
-
Policy implications: Tariffs disproportionately impact SMBs. Leaders and trade analysts urge tailored exemptions or graduated duties to preserve viability.
Strategic Insights for SMB Importers
-
Choose categories wisely: Focus on sectors with tariff flexibility, opt for non-Chinese suppliers or nations outside dispute zones.
-
Leverage to minimize: Use the $800 threshold for low-value shipments to bypass customs duties.
-
Diversify origin: Shift toward Mexico, Vietnam, India, common trends include outdoor gear and apparel producers relocating supply chains.
-
Negotiate freight: Bulk Sea freight drives cost-efficiency for machinery and fabrics. Lock in rates where possible.
-
Access US trade data: Use Trade-by-Industry Statistics to benchmark industry peers and make informed sourcing decisions.
Future Outlook
-
Rising e-commerce impact: Growth in low-value, direct shipments, SMBs increasingly use e-commerce platforms to import specialty goods.
-
Data enhancements ahead: OECD and U.S. Census are refining breakdowns by firm size and product, and SMB import trends will become even more visible.
-
Policy tailwinds or headwinds: Tariff modifications, bilateral trade deals, or exemptions could reshape costs and supply availability for SMB-focused sectors like apparel and machinery.
Final Take
-
SMBs dominate U.S. importers by number (96–97%) and hold 32% of import value.
-
They import across various sectors, including electronics, textiles, auto parts, machinery, and pharmaceuticals.
-
Tariffs are squeezing small firms hard; economic relief measures are needed.
-
Strategic moves, such as origin diversification, de minimis savvy, and freight planning, are key.
-
With better data and policymaking, SMBs can thrive as vital players in America’s global trade ecosystem.
Trends in US Small Business Imports
-
Increasing Globalization: With the advancement of e-commerce and digital technologies, US small businesses are increasingly engaging in cross-border trade and importing goods from overseas suppliers.
-
Focus on Quality and Innovation: SMEs prioritize importing high-quality products and innovative solutions to differentiate themselves in the market and attract discerning customers.
-
Supply Chain Diversification: To mitigate risks and ensure a stable supply of goods, US small businesses are diversifying their import sources and exploring new markets for sourcing products.
Conclusion
In conclusion, US small businesses play a vital role in driving import activities and contributing to the country's economic prosperity. By understanding what US SMEs import the most, policymakers, industry stakeholders, and business owners can make informed decisions to support and enhance small business growth. As SMEs continue to expand their global reach and import a diverse range of goods, it's essential to monitor import trends and anticipate future market demands.
We hope that you liked our interactive blog report on the top imports by the US small businesses in 2025. To access the latest US trade trends & US export-import data, visit USImportdata. Contact us at info@tradeimex.in and get a verified list of the top US importers, along with a customized database report.
What's Your Reaction?