US Aluminum Exports by Country | Top Aluminum Exporters in USA
Discover the latest insights on US aluminum exports, valued at $14.41 billion in 2024 & $6.88 billion in 2025. Explore top aluminum exporter & aluminum exports by country.

Introduction: The Global Importance of the U.S. Aluminum
Aluminum is a strategic metal, lightweight, durable, and vital to industries ranging from aerospace and automotive to construction, packaging, and renewable energy infrastructure. For the United States, the aluminum trade is both an opportunity and a challenge. The country is among the top consumers of aluminum globally, but its role as an exporter is more nuanced. The United States has a modest base of primary aluminum production, just under 1 million metric tons annually, but it possesses a powerful recycling sector and downstream industries that produce alloys and semi-finished products. According to the US export data and aluminum export data of the USA, the total value of US aluminum exports reached $14.41 billion in 2024, a 1% increase from the previous year. The largest aluminum exporters play a major role in shaping global supply chains, and discussions often lead to questions like: Does the US export aluminum?
While the U.S. is better known for being a major importer, it does ship certain aluminum products abroad, which brings up another common question: how much aluminum does the US export? Though the volumes are smaller compared to global giants, the U.S. remains part of the international flow of semi-finished and specialized aluminum goods. When looking at the top exporters of aluminum, countries with strong mining, refining, and smelting capabilities dominate the charts, driving competition and influencing worldwide pricing and availability.
The US exported aluminum worth $6.88 billion in the first two quarters or first 6 months of 2025, as per the US aluminum export statistics. The USA is the 3rd largest aluminum exporter in the world, as per the global trade data. This mix makes the U.S. not a dominant exporter in raw tonnage, but a significant one in value-added aluminum exports, as per the reports of Aluminum Statistics and Information.
By 2024, U.S. aluminum exports reached around 14.4 billion USD, representing a strong rebound from earlier years disrupted by trade tensions, tariffs, and pandemic-related supply chain interruptions. Exports grew steadily in volume, though unit prices softened, reflecting broader commodity market dynamics. Understanding where U.S. aluminum flows, what forms it takes, and how trade relationships are shifting is essential for policymakers, manufacturers, and traders alike. In this article, we will delve into the latest data on US aluminum exports by country for the years 2024-25, shedding light on the key trends and insights in this sector.
How Much Aluminum Does the U.S. Export?
In 2024, the United States exported approximately 774,000 tonnes of unwrought aluminum, up nearly 19% compared to 2023. This was the fourth consecutive year of growth in shipment volumes after a dip earlier in the decade.
However, while volumes grew, the export value declined slightly, down about 6% compared to 2022. The average export price slipped to around 2,200 USD per ton, compared to more than 2,600 USD per ton a year earlier.
This divergence, higher export tonnage but lower overall revenues, suggests that U.S. exporters are supplying larger volumes at compressed margins, likely a function of global oversupply pressures and increased competition from producers in the Middle East, Russia, and Asia.
US Aluminum Exports by Country 2025: Where does the US Export Aluminum?
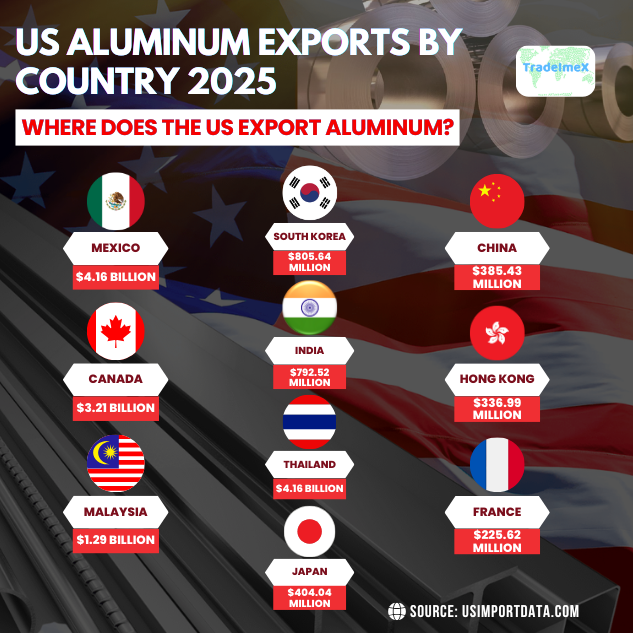
The United States continues to be a significant player in the global aluminum market, exporting its aluminum to various countries worldwide. Based on current trends and data, the US aluminum exports are diversified, with major destinations including countries such as Canada, Mexico, Japan, and China. These key export partners showcase the interconnectedness of the global aluminum trade network. The top 10 export destinations for US aluminum exports by country, as per the US aluminum export data and US shipment data for 2024-25, include:
1. Mexico: $4.16 billion (28.9%)
Mexico continues to be the top destination for US aluminum exports, accounting for nearly 29% of total exports. With a strong manufacturing sector and a growing demand for aluminum, Mexico remains a key partner for the US in the aluminum trade.
2. Canada: $3.21 billion (22.3%)
Canada is the second-largest market for US aluminum exports, capturing 22.3% of the total export value. As a close neighbor and trading partner, Canada has a long-standing relationship with the US in the aluminum industry.
3. Malaysia: $1.29 billion (9%)
Malaysia is a growing market for US aluminum exports, with a 9% share of the total export value, as per the data on US aluminum exports to Malaysia by HS code. With its expanding industrial base and infrastructure projects, Malaysia offers new opportunities for US aluminum suppliers.
4. South Korea: $805.64 million (5.6%)
South Korea is another important market for US aluminum exports, accounting for 5.6% of the total export value. With a strong focus on technology and innovation, South Korea presents a lucrative market for high-quality aluminum products.
5. India: $792.52 million (5.5%)
India is a key emerging market for US aluminum exports, with a 5.5% share of the total export value. As India continues to invest in infrastructure and construction projects, the demand for aluminum is expected to grow significantly.
6. Thailand: $758.52 million (5.3%)
Thailand is a growing market for US aluminum exports, with a 5.3% share of the total export value. With its strategic location in Southeast Asia and a booming manufacturing sector, Thailand offers new opportunities for US aluminum exporters.
7. Japan: $404.04 million (2.8%)
Japan remains an important market for US aluminum exports, capturing 2.8% of the total export value, as per US aluminum exports to Japan. With a reputation for quality and precision engineering, Japan is a sought-after market for high-value aluminum products.
8. China: $385.43 million (2.7%)
Despite trade tensions between the US and China, China remains a significant market for US aluminum exports, accounting for 2.7% of the total export value. With a large manufacturing base and a growing demand for aluminum, China continues to be an important player in the global aluminum market.
9. Hong Kong: $336.99 million (2.3%)
Hong Kong is a key market for US aluminum exports, capturing 2.3% of the total export value. With its strategic location as a gateway to the Chinese market and a hub for international trade, Hong Kong offers unique opportunities for US aluminum suppliers.
10. France: $225.62 million (1.6%)
France rounds out the top 10 countries for US aluminum exports, with a 1.6% share of the total export value. With a strong focus on sustainability and green technology, France presents opportunities for US exporters of eco-friendly aluminum products.
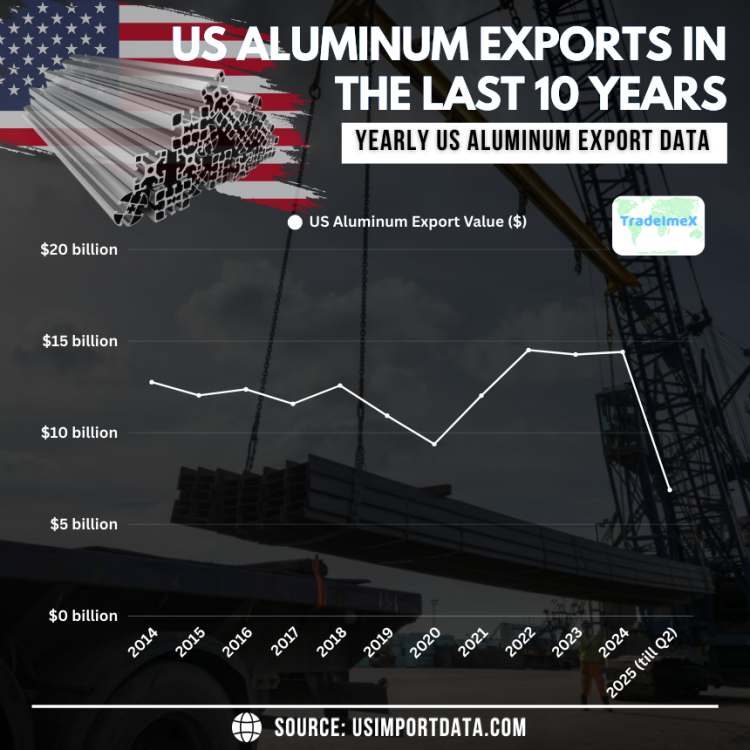
US Aluminum Exports in the Last 10 Years: Yearly US Aluminum Export Data
|
Year of Exports |
US Aluminum Export Value ($) |
|
2014 |
$12.76 billion |
|
2015 |
$12.04 billion |
|
2016 |
$12.37 billion |
|
2017 |
$11.58 billion |
|
2018 |
$12.58 billion |
|
2019 |
$10.93 billion |
|
2020 |
$9.38 billion |
|
2021 |
$12.03 billion |
|
2022 |
$14.51 billion |
|
2023 |
$14.27 billion |
|
2024 |
$14.41 billion |
|
2025 (till quarter 2/first six months) |
$6.88 billion |
What Types of Aluminum Are Exported by the US?
U.S. aluminum exports are not evenly distributed across product categories. A breakdown for 2024 shows:
-
Unwrought aluminum alloys: 587,000 tonnes, representing three-quarters of total export volumes. In value terms, this segment generated nearly 1.5 billion USD. These alloys are in demand across automotive manufacturing, aerospace, and advanced machinery industries.
-
Unwrought non-alloy aluminum: 188,000 tonnes, accounting for about 13% of total value (220 million USD). This segment tends to serve lower-value industrial applications.
-
Scrap aluminum and recycled forms: The U.S. is a major exporter of scrap, shipping hundreds of thousands of tonnes to countries with large smelting capacities, particularly in Asia. Scrap exports are essential because domestic secondary smelters cannot absorb the entire volume of collected recyclable aluminum.
-
Semi-manufactured products (extrusions, plates, sheets, and foil): Represent a smaller but growing part of the export profile, offering higher margins due to value addition.
This product mix demonstrates the U.S.’s strength in recycling and alloys rather than large-scale production of primary, unwrought non-alloy aluminum.
Export Price Differentials by Destination
Not all aluminum exports fetch the same price. In 2024, price disparities were pronounced:
-
Shipments to Mexico commanded an average of about 3,000 USD per ton, reflecting higher-value alloys destined for automotive and aerospace supply chains.
-
Shipments to Malaysia, by contrast, averaged closer to 1,260 USD per ton, reflecting a heavier concentration of lower-value scrap and feedstock materials.
This illustrates the dual role of U.S. aluminum exports:
-
Supplying premium alloys to advanced industrial partners.
-
Offloading scrap and mid-grade alloys to processing hubs in Asia.
Comparison to Imports: A Net Importer’s Profile
Despite its export footprint, the U.S. is overwhelmingly a net importer of aluminum. In 2024, imports reached more than 27 billion USD, nearly double the value of exports.
The bulk of imports as per the US aluminum import data come from:
-
Canada: Over 9 billion USD, reflecting its dominance in primary aluminum production.
-
China: Significant volumes of aluminum products, especially semi-finished goods.
-
Mexico: Both raw and semi-finished materials flow north under USMCA integration.
This imbalance highlights a structural reality: the U.S. exports mainly scrap and alloys, while importing primary aluminum and semi-finished products to satisfy domestic demand.
Trade Policy and Tariffs: Shaping the 2025 Outlook
Aluminum has long been caught in U.S. trade policy crosshairs. Since 2018, tariffs have been used to protect domestic smelting capacity, though with mixed results. In 2025, tariffs escalated further:
-
Import duties on selected aluminum products rose from 10% to 25% in early 2025.
-
By mid-year, some categories were subject to 50% tariffs, particularly from countries deemed “unfair traders.”
These measures have raised the cost of imported primary aluminum, but they have also incentivized downstream producers in the U.S. to export alloys and scrap, which face fewer restrictions abroad.
The result: a paradox where the U.S. imports expensive primary aluminum while simultaneously exporting large volumes of scrap and mid-tier alloys.
Domestic Production and Recycling Trends
The U.S. primary aluminum sector has shrunk dramatically from its historical highs. In 1980, the U.S. produced more than 4.5 million tonnes of primary aluminum. By 2023, output was just 860,000 tonnes, concentrated in a handful of smelters.
By contrast, secondary aluminum production based on recycling has soared. In 2023, U.S. recyclers produced over 3.4 million tonnes of aluminum from scrap, nearly four times the primary output.
This recycling dominance shapes the export profile. The U.S. generates far more scrap aluminum than it can process domestically, making exports to Malaysia, India, and other reprocessing hubs economically attractive.
Year-on-Year Dynamics: 2024 into 2025
-
2024: Export volumes surged nearly 20%, but values slipped due to falling global prices. Scrap shipments led the growth, particularly to Malaysia.
-
2025 (first half): Trade data shows steady exports, with Mexico overtaking Malaysia in terms of export value, even if Malaysia continues to dominate in volume. Prices remain compressed due to global supply gluts, though tariffs on imports are expected to shift trade flows in the second half of the year.
Strategic Implications for US Aluminum Exports
-
Concentration Risk: With nearly all aluminum exports going to just three markets, the U.S. is vulnerable to demand shocks in those economies.
-
Value vs. Volume: Premium alloys shipped to Mexico yield the highest margins. Scrap shipments to Asia, while large in volume, contribute less to export earnings.
-
Environmental Edge: The recycling-driven export base positions the U.S. as a leader in sustainable aluminum trade, a potential selling point in global markets where low-carbon aluminum is in demand.
-
Policy Tensions: Tariffs raise domestic production costs but simultaneously encourage more exports of surplus scrap and alloys. This balancing act will remain contentious.
-
Future Growth Markets: Beyond Malaysia, Mexico, and Canada, emerging destinations like India, Vietnam, and Thailand are poised to absorb more U.S. aluminum as their industrial bases grow.
Key Metrics Summary
|
Metric |
2024 Value |
2025 (Estimates) |
|
Total Export Value |
14.4 billion USD |
Similar levels, slightly higher |
|
Export Volume |
774,000 tonnes |
Growing ~5–7% YoY |
|
Top Destinations |
Malaysia, Mexico, Canada |
Same, with Mexico rising in value share |
|
Average Export Price |
2,200 USD/ton |
Stable to slightly lower |
|
Highest Price by Destination |
Mexico (~3,000 USD/ton) |
Similar trend |
|
Lowest Price by Destination |
Malaysia (~1,260 USD/ton) |
Similar trend |
|
Import Value |
27 billion USD |
Growing amid tariffs |
|
Primary Production |
860,000 tonnes |
Flat/slightly lower |
|
Secondary (Recycled) Production |
3.4 million tonnes |
Growing steadily |
Conclusion and Final Thoughts
In conclusion, the US aluminum exports in 2024–25 highlight the complex interplay between domestic production, recycling strength, and global trade flows. The United States has become a major exporter of scrap and alloyed aluminum, particularly to Malaysia, Mexico, and Canada. Yet it remains heavily reliant on imports of primary aluminum to meet domestic demand. Looking forward, the U.S. aluminum export market will continue to grow in volume, especially in recycled forms, but value growth may remain modest unless exporters move further up the value chain with specialty alloys and semi-finished products.
The big picture is clear: the U.S. is not a global aluminum export giant like Canada, Russia, or the UAE, but it occupies a crucial niche, supplying high-value alloys to advanced industries and recyclable feedstock to global processing hubs. In a world increasingly focused on sustainability, the U.S.’s recycling-driven aluminum exports could become a strategic advantage.
We hope that you liked our insightful blog report on US aluminum exports data 2025. For more such insights into the latest US import-export data or to search live data on US aluminum exports by country, visit USImportdata. Contact us at info@tradeimex.in for customized US trade database reports, market insights, and get a verified list of the top Aluminum exporters in the USA, as per your business needs.
What's Your Reaction?