US-Indonesia Trade Deal Explained: How Cutting Tariffs to 19% Could Transform US-Indonesia Trade
Discover how the US-Indonesia trade deal cuts tariffs from 32% to 19% & what the new US-Indonesia trade agreement means for businesses, investments, & future tariffs on Indonesia.
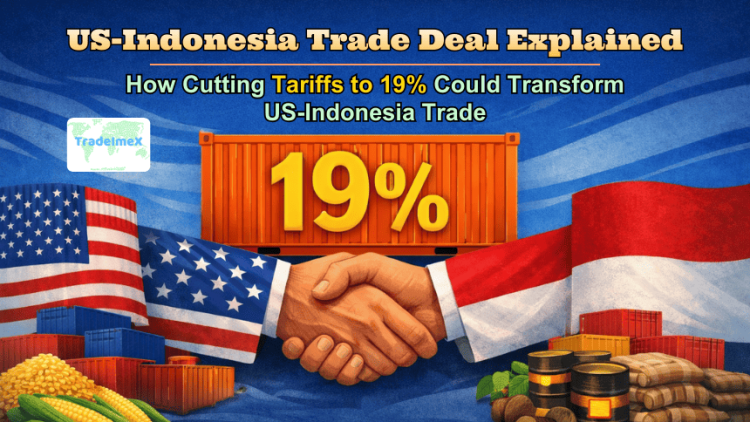
In February 2026, the governments of the United States and Indonesia finalized a new trade agreement that sets U.S. tariffs on most Indonesian exports at 19 percent. The deal was announced following talks between President Donald Trump & Indonesian President Prabowo Subianto and is being framed as a reset in bilateral economic relations. At first glance, 19 percent still sounds high. It is not a free trade agreement in the traditional sense. But compared with the previously threatened 32 percent tariff rate, it represents a substantial reduction. That shift alone changes the math for exporters, importers, and investors on both sides of the Pacific.
Based on the most recent US import data & Indonesia export data, the US imports from Indonesia totaled $29.54 billion in 2024. During the same year, the total US exports to Indonesia reached $10.20 billion, as per the US export data. Taken together, the overall value of US-Indonesia trade reached $39.74 billion in 2024 and $43.56 billion in the first 11 months of 2025.
This article breaks down what the deal includes, why the 19 percent number matters, how it compares with past arrangements, which sectors stand to gain or lose, and what it could mean for supply chains and geopolitics in Southeast Asia.
The Starting Point: A $40+ Billion Trade Relationship
Before looking at the policy change, it helps to understand the baseline.
Bilateral goods trade between the United States and Indonesia has hovered around the $40–45 billion range in recent years. Indonesia exports more to the U.S. than it imports, giving it a goods trade surplus. Key Indonesian exports include:
-
Apparel and footwear
-
Rubber products
-
Palm oil derivatives
-
Electronics components
-
Furniture
-
Seafood
Major U.S. exports to Indonesia include:
-
Agricultural commodities (soybeans, wheat, corn, cotton)
-
Aircraft and aerospace components
-
Energy products (LNG, refined fuels)
-
Machinery and industrial equipment
-
Medical and pharmaceutical products
Indonesia is Southeast Asia’s largest economy by population and GDP, and the world’s largest producer of nickel, a critical mineral used in batteries. That makes it commercially and strategically important in the US-Indonesia trade relations.
Against this backdrop, tariff policy became a pressure point. The recent developments around the United States and indonesia reach historic trade deal have brought major attention to Indonesia tariffs to USA and the broader framework of the US-Indonesia trade agreement. With revisions to Tariffs on Indonesia, businesses are closely monitoring the implications of the US tariff on Indonesia 2026 and how it will reshape bilateral trade.
The new Trade agreement between Indonesia aims to address the US-Indonesia trade deficit while strengthening US-Indonesia relations through improved US-Indonesia balanced market access. As discussions around the US-Indonesia trade deal continue, policymakers and exporters alike are evaluating how adjustments in US-Indonesia tariff structures will influence long-term trade flows and investment opportunities.
From 32% to 19%: Why the Reduction Is Significant
The earlier threat of 32 percent tariffs would have dramatically reshaped trade flows. For many Indonesian exporters operating on thin margins, a 32 percent duty would have priced them out of the U.S. market or forced renegotiations across supply chains.
To understand the effect, consider a simplified example:
-
An Indonesian apparel exporter sells a $10 shirt to a U.S. importer.
-
At 32 percent, the tariff adds $3.20.
-
At 19 percent, it adds $1.90.
That $1.30 difference per unit becomes enormous at scale. For a shipment of 10 million units, it means $13 million in cost savings relative to the higher tariff scenario.
In sectors like textiles and footwear, where profit margins often sit between 5 and 12 percent, a 13-point tariff swing can determine whether a contract is viable.
So while 19 percent remains elevated compared to many free trade agreements, the reduction from 32 percent is economically meaningful.
Overview: What the US-Indonesia Trade Deal Actually Is
On 19–20 February 2026, the United States and Indonesia finalized a reciprocal trade agreement that will:
-
Fix U.S. tariffs on most Indonesian exports at 19 percent, significantly lower than a previously threatened 32 percent level if no deal had been reached.
-
Eliminate over 99 percent of Indonesian tariffs on American goods, including industrial, agricultural, and technological imports.
-
Include exemptions for select commodities. Indonesian products like coffee, chocolate, and natural rubber will have zero U.S. tariffs, and future mechanisms may lighten duties on textiles and other items.
-
Feature major commercial commitments. Indonesia agreed to buy roughly $33 billion worth of U.S. products spanning the energy, aerospace, and agriculture sectors.
The formal document ratifies months of negotiation that began in mid-2025, when Washington first signaled a new “reciprocal tariff” policy toward Indonesia under the U.S. administration’s trade strategy.
Why the 19% Tariff Matters
Tariffs aren’t just tax lines; they are levers of economic influence.
From 32% to 19%: A Big Shift
Under initial U.S. tariff proposals in 2025, Indonesia faced a steep 32 percent duty on many of its exports to the United States, a rate that would have severely undercut competitiveness in one of the world’s largest consumer markets.
Cutting that rate to 19 percent has three broad implications:
-
Economic breathing room for exporters: A lower tariff makes Indonesian goods more price-competitive in the U.S. market, reducing the cost penalty for importers and potentially boosting sales volumes.
-
Market certainty for investors: Traders and firms respond sharply to tariff uncertainty; reducing the rate stabilizes expectations for supply chains and investments.
-
Policy signal: The 19 percent figure has become a benchmark in recent U.S. deals with other Southeast Asian partners, signaling a new equilibrium in how Washington bargains with emerging economies.
But it’s important to note: 19 percent is still high by many trade-agreement standards, and remains above normal tariff rates in most developed markets. This reflects a political choice rather than a market one: the U.S. prioritized strategic leverage over tariff elimination.
A Closer Look at the US-Indonesia Agreement Terms
Official documents from the U.S. Trade Representative and Indonesian officials provide more detail on what both sides will deliver:
Indonesia’s Commitments
-
Remove almost all tariffs on U.S. exports to Indonesia (across agriculture, health products, ICT, automobiles, chemicals, and more).
-
Eliminate many non-tariff barriers, such as local content requirements, certification rules, and unequal regulatory standards.
-
Open up digital trade and adopt U.S. standards on certain product safety and trade rules.
-
Expand access to critical mineral exports (e.g., nickel and cobalt), aligning with U.S. supply chain interests.
United States’ Commitments
-
Maintain a 19 percent tariff on Indonesian imports, with selected products exempted or eligible for a 0 percent tariff through quota systems.
-
Establish tariff-rate quotas for certain apparel and textile products connected to U.S. inputs.
The reciprocal nature of the pact, U.S. tariffs on Indonesian goods, and Indonesian duties on U.S. goods are a deliberate framing. It allows both countries to claim concessions while controlling politically sensitive tariff levers at home.
Leading US Imports from Indonesia: What America Buys from Indonesia
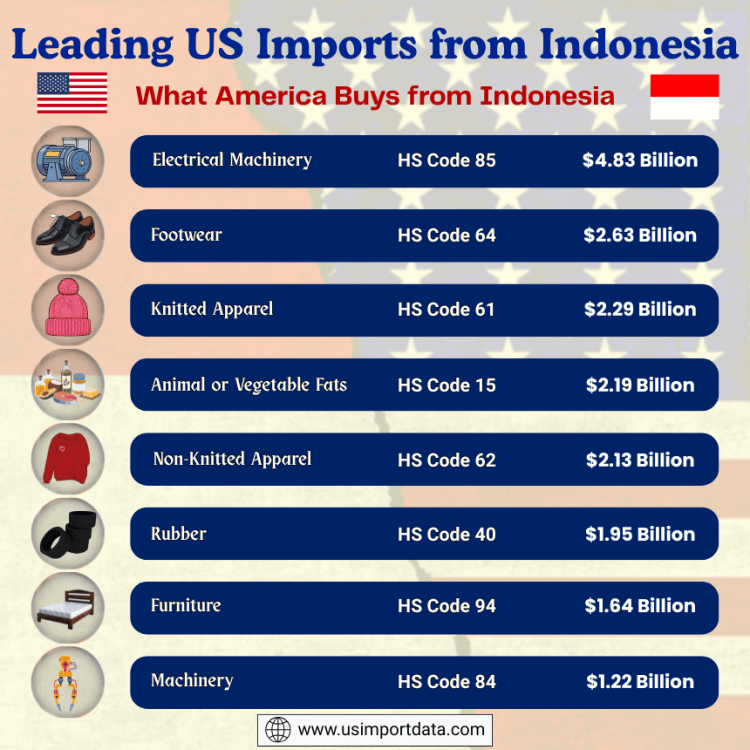
Trade between the United States and Indonesia covers a wide mix of consumer and industrial goods, reflecting a well-established commercial partnership. Indonesia supplies products that feed directly into American retail shelves, factories, and supply chains. Based on US import statistics and bilateral trade data for 2025, the following are the top goods the US imports from Indonesia:
1. Electrical Machinery & Equipment (HS Code 85): $4.83 Billion
Electrical machinery ranks as the largest import category from Indonesia. This segment includes products such as electric motors, generators, transformers, wiring equipment, and other electrical components. With imports totaling $4.83 billion, Indonesian-made electrical goods play a critical role in the US manufacturing, construction, and consumer electronics industries.
2. Footwear (HS Code 64): $2.63 Billion
Footwear is another major import segment. Valued at $2.63 billion, Indonesian shoes, from casual sandals to athletic sneakers, are widely distributed across US retail markets. Competitive pricing, skilled manufacturing, and strong global brands sourcing from Indonesia help drive this demand.
3. Knitted Apparel (HS Code 61): $2.29 Billion
Knitted garments, including T-shirts, sweaters, and activewear, make up a significant portion of US apparel imports from Indonesia. With shipments totaling $2.29 billion, these products combine affordability with large-scale production capacity, making Indonesia a key supplier for American clothing brands.
4. Animal or Vegetable Fats & Oils (HS Code 15): $2.19 Billion
Indonesia is a leading global producer of palm oil and related products. US imports in this category reached $2.19 billion. These oils are widely used in processed foods, cosmetics, household goods, and industrial applications.
5. Non-Knitted Apparel (HS Code 62): $2.13 Billion
In addition to knitwear, woven clothing items such as jackets, trousers, and formalwear are also major imports. At $2.13 billion, this category highlights Indonesia’s strength in garment manufacturing across multiple fabric types.
6. Rubber & Rubber Products (HS Code 40): $1.95 Billion
Natural rubber and related products are central to Indonesia’s export profile. The US imported $1.95 billion worth of rubber goods, which are widely used in automotive tires, industrial components, construction materials, and consumer products, as per the data on US rubber imports from Indonesia.
7. Furniture, Bedding, & Mattresses (HS Code 94): $1.64 Billion
Indonesia’s furniture sector is known for wood craftsmanship and durable materials. Imports in this category totaled $1.64 billion, supplying US homes, offices, & hospitality businesses with a range of finished furniture products.
8. Machinery & Mechanical Appliances (HS Code 84): $1.22 Billion
Machinery imports reached $1.22 billion. This broad category includes industrial machines, mechanical equipment, and components used in manufacturing, power generation, and processing industries.
9. Fish & Seafood (HS Code 03): $1.14 Billion
As the world’s largest archipelagic country, Indonesia has abundant marine resources. US seafood imports from Indonesia totaled $1.14 billion, including shrimp, tuna, and other fish products that supply grocery chains and food service providers.
10. Leather Goods (HS Code 42): $910.46 Million
Leather products such as handbags, wallets, belts, and other accessories account for $910.46 million in imports. Indonesian leather goods are valued for skilled craftsmanship and competitive pricing.
Together, these categories show how Indonesian exports support both everyday consumer markets and core US industries.
Major US Exports to Indonesia: What America Sells to Indonesia
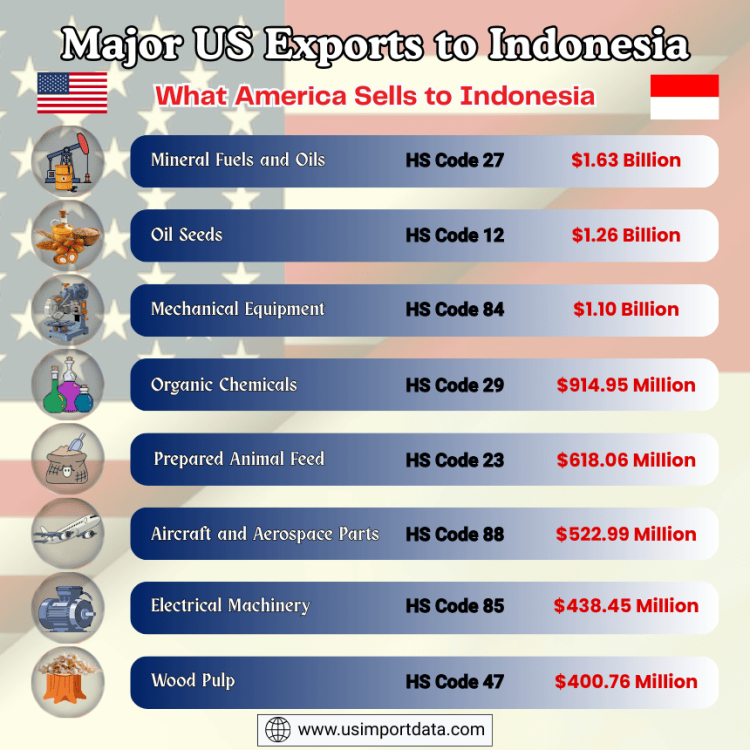
Trade flows move in both directions. The United States exports a diverse range of goods to Indonesia, contributing to economic cooperation across energy, agriculture, aerospace, healthcare, and industrial sectors. Based on US shipment data for 2024–25, these are the leading American exports to Indonesia:
1. Mineral Fuels & Oils (HS Code 27): $1.63 Billion
Energy products are the largest US export category to Indonesia. Valued at $1.63 billion, this includes crude oil, refined petroleum products, gasoline, and diesel. Indonesia’s expanding economy and energy demand make it a key market for US fuel suppliers.
2. Oil Seeds & Oleaginous Fruits (HS Code 12): $1.26 Billion
Agricultural exports such as soybeans and other oilseeds reached $1.26 billion. These commodities are essential for food production, cooking oils, and animal feed, supporting Indonesia’s agricultural and food processing industries.
3. Machinery & Mechanical Equipment (HS Code 84): $1.10 Billion
Industrial machinery exports totaled $1.10 billion, according to the data on US machinery exports to Indonesia by HS code. These products include heavy equipment, turbines, engines, and other mechanical systems used in infrastructure development, manufacturing, and energy projects.
4. Organic Chemicals (HS Code 29): $914.95 Million
US exports of organic chemicals reached nearly $915 million. These chemicals serve as key inputs for pharmaceuticals, plastics, fertilizers, and other industrial applications within Indonesia’s growing economy.
5. Prepared Animal Feed (HS Code 23): $618.06 Million
Prepared animal feed and supplements accounted for $618.06 million in exports. Indonesia’s expanding livestock and poultry sectors rely on imported feed ingredients to maintain production efficiency.
6. Aircraft & Aerospace Parts (HS Code 88): $522.99 Million
Aircraft, helicopters, and aerospace components totaled $522.99 million. With air travel demand increasing across Indonesia’s islands, US aerospace exports support fleet expansion and aviation infrastructure.
7. Electrical Machinery & Equipment (HS Code 85): $438.45 Million
Electrical equipment exports reached $438.45 million. These products include power systems, electronic components, and electrical appliances used in commercial and industrial projects.
8. Wood Pulp (HS Code 47): $400.76 Million
Wood pulp exports totaled $400.76 million. This raw material is used in paper and packaging production, sectors that continue to expand with e-commerce growth and consumer demand.
9. Optical, Medical, Surgical Instruments (HS Code 90): $271.24 Million
Medical devices and precision instruments reached $271.24 million. These imports help meet Indonesia’s healthcare needs, particularly as the country invests in expanding hospital infrastructure and improving medical services.
10. Dairy Products (HS Code 04): $214.75 Million
Dairy exports, including milk powder, cheese, and butter, amounted to $214.75 million. Rising incomes and shifting dietary preferences in Indonesia are driving increased demand for dairy imports.
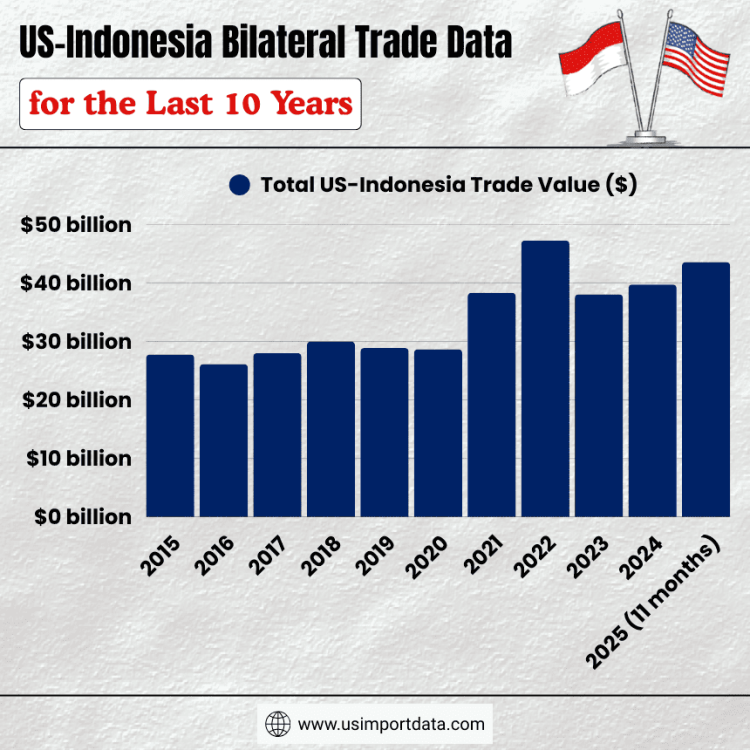
US-Indonesia Bilateral Trade Data for the Last 10 Years
|
Year of Trade |
Total US-Indonesia Trade Value ($) |
|
2015 |
$27.76 billion |
|
2016 |
$26.14 billion |
|
2017 |
$28 billion |
|
2018 |
$29.98 billion |
|
2019 |
$28.87 billion |
|
2020 |
$28.66 billion |
|
2021 |
$38.30 billion |
|
2022 |
$47.24 billion |
|
2023 |
$38.04 billion |
|
2024 |
$39.74 billion |
|
2025 (11 months) |
$43.56 billion |

Quantifying the Trade Relationship
To understand why this deal matters, it helps to put the figures in context:
Annual Bilateral Trade
-
The U.S. and Indonesia exchange tens of billions of dollars in goods annually. In 2025, estimates placed bilateral trade at over $43 billion.
-
Major U.S. imports from Indonesia include textiles, footwear, rubber products, palm oil derivatives, electronics, and furniture.
-
U.S. exports to Indonesia include energy products (e.g., liquefied natural gas and fuel), agricultural commodities, commercial aircraft, and industrial machinery.
Trade Balance and Industrial Impact
Before the deal, the U.S. recorded a trade deficit with Indonesia in goods trade, meaning the U.S. imported more than it exported. Reducing barriers to American exports and increasing purchases were priorities in negotiations.
Sectoral Impacts: Who Wins and Who Loses
Trade deals rarely affect all sectors equally. Here’s a breakdown of likely impacts:
U.S. Gains
1. Manufacturing and Heavy Industry: Indonesia agreed to purchase $13.5 billion in aerospace products, including aircraft from major U.S. producers, a direct boost to a capital-intensive U.S. sector.
2. Agriculture and Energy
-
$15 billion in U.S. energy commodities (crude oil, refined products, LPG).
-
Significant agricultural exports: soybeans, wheat, corn, cotton, beef, and rice, helping U.S. farm exports diversify.
3. Digital and Tech Services: By aligning on digital trade standards and reducing barriers, U.S. technology firms gain a more predictable footprint in Southeast Asia’s largest economy.
4. Critical Minerals: Expanded access to nickel and cobalt supports U.S. strategic supply chains for electric vehicles (EVs) and batteries.
Indonesia’s Wins
1. Improved Market Access: Even with the 19 percent tariff, Indonesian exporters retain access to a massive consumer base, particularly in textiles and rubber products, which previously faced uncertainty around tariff hikes.
2. Policy Stability: After periods of tariff volatility, the deal stabilizes long-term export rules, a boon for foreign direct investment decisions. Lower duties help Indonesian manufacturers plan and scale.
3. Potential Growth in Processing Industries: If exemptions succeed (especially for textiles and palm oil), Indonesia could capture greater value by moving goods up the value chain rather than exporting raw commodities.
Broader Geopolitical and Economic Significance
This bilateral deal doesn’t just move goods, it fits into larger strategic shifts:
ASEAN and Regional Positioning
Southeast Asia is a central hub for global supply chains. Securing a stable U.S. trade relationship helps Indonesian policymakers navigate between larger players, especially China, without fully aligning with one side.
Some analysts view the deal as part of a larger U.S. effort to rejig economic ties across ASEAN and the Indo-Pacific, balancing trade pressure from China. The reciprocal tariff framework has even been applied to other ASEAN partners at 19 percent, indicating a patterned approach.
Inflation and Consumer Prices
The worldwide impact of tariffs has been mixed. Some economists argue that tariffs can raise consumer prices, while others see modest effects due to market adjustments. The inflationary influence of U.S. tariff policy remains an open question, but stabilizing duties is generally favorable for price predictability.
Criticisms and Concerns
No major trade deal is without controversy:
High Tariff Still a Barrier
Although 19 percent is lower than 32 percent, it remains substantially above average tariff levels under most contemporary free trade agreements. Critics argue that U.S. protectionism may dampen Indonesian exports relative to what could be achieved under a standard free trade pact.
Political, Not Purely Economic, Motivations
Some observers suggest the deal was as much about geopolitics and domestic political signaling as economics, a move to show strong trade wins ahead of elections and global trade talks. Skeptics worry that this could prioritize short-term rhetoric over long-term economic openness.
Uneven Sectoral Groups
While upstream sectors like mining and energy gained leverage, smaller producers, especially in fisheries and labor-intensive industries, may feel the 19 percent tariff pinches on price competitiveness. Earlier surveys indicated Indonesian seafood exporters faced headaches from previous tariff volatility; some of those concerns may persist.
Long-Term Outlook: What Comes Next
The near-term effects of this trade deal will emerge through official implementation in the coming months. But here’s what to watch:
1. Implementation Phase
Both countries must complete domestic legal procedures before the agreement enters into force, typically within 90 days of signing.
2. Tariff Exemption Negotiations
Indonesia continues negotiating to lower the tariff rate from 19 percent to even lower levels (e.g., 18 percent) for certain products, aligning with other ASEAN partners’ deals.
3. Investor Response
Foreign investors track tariff stability closely. If the U.S.-Indonesia pact reduces risk perceptions and spurs capital inflows, especially into manufacturing and infrastructure, the long-term economic trajectory could shift significantly.
Conclusion and Final Takeaway
In conclusion, the U.S.-Indonesia trade deal that sets tariffs at 19 percent is a balanced, though politically nuanced outcome. It reduces trade friction from a potentially damaging 32 percent rate, sharpens market access for both sides, and embeds economic cooperation into a broader strategic relationship. For Indonesia, the pact offers market access and policy certainty that could unlock exports and investment. For the United States, it secures commercial commitments, addresses trade imbalances, and cements influence in a vital region.
While economists will debate how much prices, production, and investment change because of this deal, one thing is clear: bilateral trade policy is entering a new phase, one that will reverberate well beyond the current tariff figures.
Note For Our Readers
We hope you liked our insightful blog report on the US-Indonesia tariff deal and found it helpful. Want deeper insights, real-time US trade data, and market intelligence? Visit USImportdata and reach out at info@tradeimex.in to access live US import–export data by country, HS code, or specific product. Stay informed & skyrocket your business with our customized database reports.
What's Your Reaction?