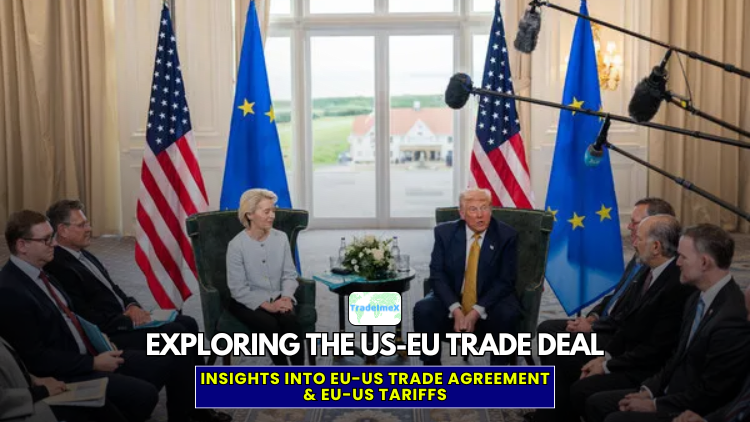
Exploring the US-EU Trade Deal: Insights into EU-US Trade Agreement & Tariffs
Explore the 2025 US-EU trade deal, tariff updates, sector impacts, and trade statistics. A data-driven analysis of the EU-US economic partnership.
Introduction
The United States and the European Union are the two largest economic powers in the world. Together, they account for nearly half of global GDP, about a third of global trade in goods and services, and the majority of foreign direct investment flows. Their relationship is one of deep interdependence, with trillions of dollars in goods, services, and capital flowing across the Atlantic every year. As far as the bilateral trade is concerned, the total value of US-EU trade reached around $1.5 trillion in 2024, as per the US export data and the Europe trade data. The US-EU trade totaled $639.66 billion in the first two quarters of 2025, as per the US-EU trade statistics. The latest US-EU trade deal, concluded in mid-2025, represents a significant attempt to reset and stabilize this partnership. Tensions in transatlantic commerce are often framed as a US EU trade war, driven by disputes over US tariff on EU products and ongoing questions like does the EU have tariffs on US goods.
While retaliatory measures such as US tariffs on EU goods and broader US tariffs on European goods continue to affect industries on both sides, keeping negotiations for an EU US tariff deal at the center of efforts to de-escalate trade conflicts and stabilize US–EU economic relations. US President Donald J. Trump and European Commission President Ursula von der Leyen reached a trade and tariff agreement on July 27, 2025. The transatlantic partnership is the most important bilateral trade and investment relationship in the world and a vital conduit of international trade. Discussions about global commerce often focus on US trade with Europe, including the broader framework of US trade with EU, as people seek to understand what does the US import from Europe, such as vehicles, pharmaceuticals, machinery, and luxury goods, while policy makers also debate the impact and future potential of an EU trade deal with USA on economic growth and cooperation.
Yet, this relationship is also marked by friction. Over the past decade, disputes over tariffs, subsidies, regulatory standards, and national security measures have frequently brought the two sides to the brink of full-scale trade wars. This article explores the economic background, tariff structures, sectoral impacts, and geopolitical significance of the US-EU trade agreement. It also provides data-driven insights into how the new rules may shape trade flows, corporate strategies, consumer costs, and political dynamics in the years ahead.
The Scale of US-EU Trade
Understanding the importance of this deal requires a look at the scale of transatlantic commerce. The EU and the US are each other’s largest trading partners. In 2023, total trade in goods and services between the two blocs was roughly €1.6 trillion (about $1.7 trillion). The United States ranked as the largest partner for EU exports in 2024 (20.6%) and the second-largest partner for EU imports (13.7%). In 2024, Germany was the top exporter of commodities to the US, as per the data on US imports from Germany, and the Netherlands was the top importer of goods from the US among EU nations, as per the data on US exports to the Netherlands.
-
Goods Trade
-
US Exports to the EU: $451 billion.
-
US Imports from the EU: $687 billion.
-
EU exports to the US: €503 billion.
-
EU imports from the US: €347 billion.
-
This produced an EU goods trade surplus of approximately €157 billion.
-
Services Trade
-
EU exports of services to the US: about €319 billion.
-
EU imports of services from the US: about €427 billion.
-
The EU therefore runs a services trade deficit of about €109 billion with the US.
-
Investment Flows: Foreign direct investment ties are even larger. EU and US companies collectively hold more than €4.7 trillion invested in each other’s markets. These investments support millions of jobs, provide tax revenue, and anchor supply chains across industries from finance to automotive to technology.
From these figures, it is clear why tariff decisions carry enormous weight. A modest percentage increase in duties applied to such volumes translates into tens of billions of euros or dollars in costs.
Why a New US-EU Trade Deal Was Needed
The latest round of negotiations was triggered by several factors:
1. Escalating Tariff Threats: In recent years, the US has invoked national security arguments under Section 232 of its trade law to impose tariffs on key imports like steel and aluminium. Automobiles and auto parts were also under threat of tariffs as high as 30–50%. The EU had drawn up lists of retaliatory tariffs on US goods worth tens of billions. Without an agreement, a spiral of retaliation seemed likely.
2. Economic Exposure: Many European industries are highly dependent on the US market. For example, Germany’s auto sector, Ireland’s pharmaceuticals industry, and France’s aerospace sector all count the US as a top destination. Similarly, many American industries, from medical equipment to energy exports, rely heavily on EU demand. The threat of higher tariffs posed risks to jobs, competitiveness, and growth on both sides.
3. Policy Uncertainty: Businesses operate best with predictable rules. The threat of sudden tariff hikes or retaliatory duties had created uncertainty in investment planning, supply chain design, and pricing strategies. A framework agreement promised to restore some clarity.
4. Political Pressures: Both the US and the EU faced internal political pressures. US leaders sought to reduce trade deficits and demonstrate toughness on trade. European leaders wanted to protect exporters while avoiding an escalation that could fuel inflation. Negotiating a deal allowed both sides to claim political victories.
What the EU-US Trade Agreement Includes
The EU-US trade agreement announced in July 2025 is officially known as the Framework Agreement on Reciprocal, Fair, and Balanced Trade. Its provisions are complex, but the main pillars can be summarized as follows:
1. A 15% Tariff Ceiling on EU Goods Entering the US
The US has committed to capping tariffs on most EU goods at a combined rate of 15%. This figure includes both the standard most-favored-nation (MFN) tariff and any additional tariffs imposed under national security provisions. This is significantly lower than some of the tariffs that had been threatened, which could have exceeded 30% or even 50%.
2. Sectoral Exemptions
Not all goods are subject to the 15% rate. Some sectors are carved out:
-
Aircraft and Aircraft Parts: Exempt due to the highly integrated aerospace industry.
-
Generic Pharmaceuticals and Ingredients: Exempt to avoid disrupting healthcare supply chains.
-
Semiconductors and Critical Natural Resources: Subject to special provisions, in recognition of their strategic importance.
3. Steel and Aluminium
These products remain under elevated tariffs, up to 50%. However, both sides agreed to negotiate tariff-rate quotas (TRQs), which would allow a certain volume of imports at lower tariff levels. Details are still pending.
4. Automobiles and Auto Parts
Instead of facing potential tariffs above 25%, EU auto exports to the US will fall under the 15% ceiling. This provides relief compared to the worst-case scenario but is still a major increase from the 2–3% tariffs that applied in the pre-dispute era.
5. EU Concessions
The EU committed to reducing or eliminating tariffs on a wide range of US industrial goods. It also agreed to suspend retaliatory tariffs for an initial six-month period. Additionally, the EU pledged to purchase more American energy and defense products and to work on reducing non-tariff barriers such as certification requirements.
6. Implementation Timeline
The US tariffs took effect on August 7, 2025. The EU’s reciprocal measures require legislative approval and will be phased in over the following months. Quota mechanisms for steel and aluminium are still under discussion.
US–EU Trade Deal (2025): Key Provisions
|
Category |
What Was Agreed |
Notes / Exceptions |
|
Tariff Ceiling (Most Goods) |
15% maximum tariff on EU goods entering the US (includes both MFN + Section 232 tariffs) |
Lower than the threatened 30–50% tariffs; higher than pre-dispute levels (~2–3%). |
|
Steel & Aluminium |
Tariffs remain up to 50% |
Both sides are negotiating tariff-rate quotas (TRQs) to allow limited volumes at lower rates. |
|
Automobiles & Auto Parts |
Capped at 15% |
Significant relief compared to threatened 25%+ rates, but still higher than pre-2020 tariffs. |
|
Pharmaceuticals |
Exempt from tariffs |
Aimed at protecting healthcare supply chains and reducing inflationary risk. |
|
Semiconductors & Critical Raw Materials |
Mostly exempt or capped at 15% |
Reflects recognition of strategic importance for both economies. |
|
Aircraft & Aircraft Parts |
Exempt |
Maintains cooperation in the highly integrated aerospace sector. |
|
EU Commitments |
- Lower/eliminate tariffs on US industrial goods. - Suspend retaliatory tariffs for six months. - Increase procurement of US energy and defense products. - Work toward reducing non-tariff barriers. |
EU legislative approval is required for full implementation. |
|
Implementation |
US tariffs effective August 7, 2025. EU phased response. |
Some details (TRQs for metals) are pending negotiation. |
|
Duration / Review |
Framework subject to review and possible renegotiation |
A six-month suspension window for EU retaliation is a pressure point. |
Economic Implications
Effects on Growth
Economists estimate that the 15% tariffs will modestly slow EU growth. Projections suggest a drag of about 0.5% on EU GDP over the next two years, concentrated in export-oriented industries. For the US, the direct growth impact is smaller, but higher input costs could weigh on manufacturing.
Inflationary Pressures
Tariffs act as a tax on imports. For the US, that means higher consumer prices for European goods, including cars, specialty chemicals, and luxury items. Estimates suggest the inflationary effect could add 0.2 to 0.5 percentage points to US inflation in 2025–2026. For the EU, avoiding retaliatory tariffs helps limit inflation, but exporters may have to absorb some costs through lower margins.
Trade Balances
The US goods trade deficit with the EU was about $236 billion in 2024. The new tariffs may reduce EU exports somewhat, potentially narrowing this deficit. However, US consumers and businesses will pay higher prices, and trade volumes may decline. The US maintains a large services trade surplus with the EU, which is unlikely to be significantly affected.
Top Goods Traded Between the US & EU: US-EU Goods Trade
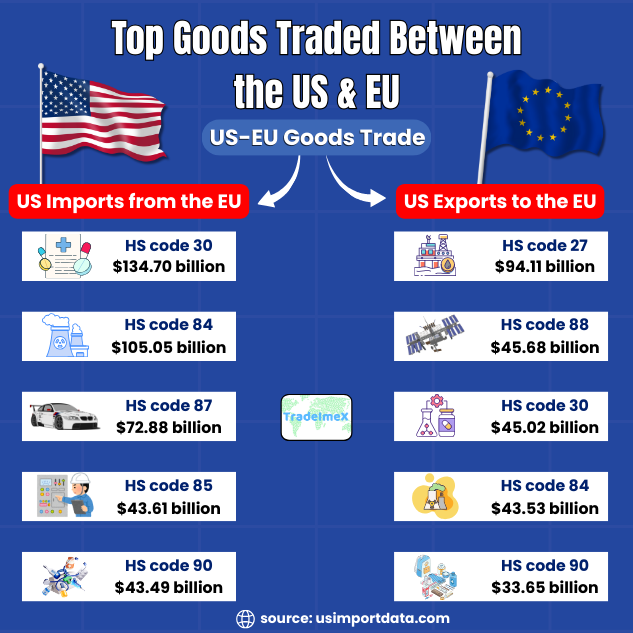
In the realm of transatlantic trade, the exchange of goods between the United States and the European Union holds significant importance. The top goods traded between these economic powerhouses encompass a wide range of products, including automobiles, pharmaceuticals, aircraft, machinery, and medical instruments. These items not only represent the strong economic ties between the US and EU but also contribute to the growth and prosperity of both regions. The following is a list of the top goods traded between the US and EU, as per the US shipment data for 2024-25:
|
US Imports from the EU |
Import Value ($) |
US Exports to the EU |
Export Value ($) |
|
1. Pharmaceutical products |
$134.70 billion |
1. Mineral fuels & oils |
$94.11 billion |
|
2. Nuclear reactors & machinery |
$105.05 billion |
2. Aircraft, spacecraft, & parts thereof |
$45.68 billion |
|
3. Vehicles |
$72.88 billion |
3. Pharmaceutical products |
$45.02 billion |
|
4. Electrical machinery & equipment |
$43.61 billion |
4. Nuclear reactors & machinery |
$43.53 billion |
|
5. Medical or surgical instruments |
$43.49 billion |
5. Medical or surgical instruments |
$33.65 billion |
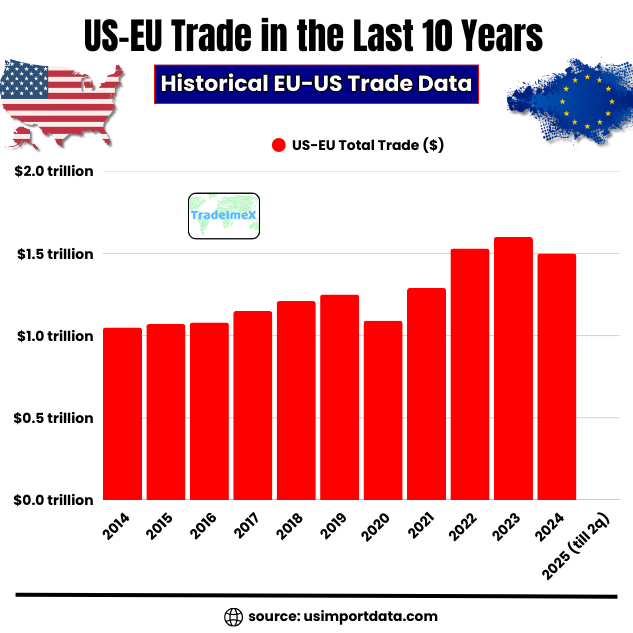
US-EU Trade in the Last 10 Years: Historical EU-US Trade Data
|
Year of Trade |
US-EU Total Trade ($) |
|
2014 |
$1.05 trillion |
|
2015 |
$1.07 trillion |
|
2016 |
$1.08 trillion |
|
2017 |
$1.15 trillion |
|
2018 |
$1.21 trillion |
|
2019 |
$1.25 trillion |
|
2020 |
$1.09 trillion |
|
2021 |
$1.29 trillion |
|
2022 |
$1.53 trillion |
|
2023 |
$1.60 trillion |
|
2024 |
$1.50 trillion |
|
2025 (till quarter 2) |
$639.66 billion |
Sector-by-Sector Impact
Automobiles
European carmakers, particularly German and Italian firms, face significant challenges. Vehicles that once entered the US with tariffs of 2.5% now face 15%. Luxury carmakers may pass some costs on to consumers, but mass-market producers will feel margin pressure. Some may accelerate investments in US assembly plants to avoid tariffs.
Pharmaceuticals
Generic drugs are mostly exempt, which protects both US patients and EU producers. However, complex biologics and specialty drugs could face tariffs if not covered by exemptions. This may push some pharmaceutical firms to adjust production footprints.
Steel and Aluminium
These remain the most heavily affected sectors, with tariffs up to 50%. European producers are at a clear disadvantage compared to US competitors. Quota negotiations may provide some relief, but the sector faces sustained headwinds.
Chemicals and Industrial Goods
Many chemicals and industrial inputs now face 15% tariffs. Since these are often intermediate goods, the tariffs raise costs for US manufacturers that depend on European supply chains. Over time, this could encourage reshoring or diversification.
Agriculture and Food
Agricultural trade is less affected by tariffs than by regulatory standards. However, some EU agricultural exports will face higher duties, and EU farmers may feel the squeeze if retaliatory measures return in the future.
Geopolitical and Strategic Dimensions
The deal is not just about economics; it reflects deeper strategic currents.
-
Trade as Security Policy: Both the US and EU are increasingly framing trade rules around national security. Sectors like semiconductors, pharmaceuticals, and critical minerals are treated not just as commodities but as strategic assets.
-
A Model for Other Agreements: The 15% tariff ceiling and sector-by-sector exemptions may serve as a model for future US trade deals with other partners, such as the UK or Japan.
-
EU Internal Politics: Different EU member states are affected differently. Germany, with its auto sector, bears more of the burden, while Ireland benefits from pharmaceutical exemptions. Balancing these interests will be politically delicate.
-
US Domestic Politics: The deal allows US leaders to claim progress in reducing trade deficits while collecting tariff revenue. However, consumer backlash over higher prices could temper enthusiasm.
Risks and Uncertainties
While the agreement reduces immediate risks of escalation, several uncertainties remain:
-
Rules of Origin: Strict rules are needed to prevent goods from third countries from being routed through the EU to bypass tariffs. Negotiations here could be contentious.
-
Implementation Delays: EU legislative processes and quota negotiations for steel and aluminium may drag on, creating uncertainty for businesses.
-
Retaliatory Measures: The EU has suspended retaliatory tariffs for six months. If implementation falters, these could return quickly.
-
Inflation Dynamics: If tariffs feed more strongly into consumer prices than expected, central banks on both sides may face new pressures.
-
Durability of the Agreement: Trade deals tied to specific administrations can be fragile. A future change in US leadership could bring new tariffs or renegotiations.
Possible Scenarios
-
Smooth Implementation: EU-US Tariffs hold steady at 15%, quotas are implemented, and exemptions are clarified. EU growth slows modestly, US inflation rises slightly, and trade volumes adjust without major disruption.
-
Partial Breakdown: Delays in exemptions or quotas create uncertainty. EU retaliation resumes, leading to reduced trade flows and deeper economic costs.
-
Full Escalation: Political tensions undo the agreement. Tariffs escalate above 30%, retaliatory measures intensify, and a full-scale trade war emerges, cutting GDP growth on both sides by more than 1%.
Conclusion and Final Verdict
The 2025 US-EU trade deal is a compromise that avoids the worst outcomes of a looming trade war. By capping most tariffs at 15% and carving out exemptions for strategic sectors, it provides businesses with a more predictable environment. Yet it also represents a clear departure from the era of transatlantic free trade ambitions, such as the abandoned TTIP negotiations of the 2010s.
For companies, the new reality is one of higher costs, more complex rules, and the need to adapt supply chains. For consumers, it may mean higher prices on imported goods. For policymakers, it underscores how trade policy is now inseparable from industrial strategy and national security. The relationship between the US and the EU will remain the most important economic partnership in the world, with the new EU-US trade deal. But it will also remain one of managed rivalry as much as cooperation. The deal buys stability for now, but the underlying tensions are far from resolved.
For more insights into the latest US import-export data, or to search live data on the US import-export by country, visit USImportdata. Contact us at info@tradeimex.in and get customized trade reports, US market insights, and an exclusive US trade database.
What's Your Reaction?