US-Indonesia Trade Relations 2025: Bilateral Trade Data & US-Indonesia Trade Deal Insights
US-Indonesia trade deal insights with latest data on Indonesia exports to the US & US imports from Indonesia. Bilateral trade hit $39.74B in 2024 amid evolving Indonesia-US trade agreement dynamics.

Introduction: Why US–Indonesia Trade Matters in 2025
Trade relations between the United States and Indonesia entered a critical phase in 2025. What had long been a stable but under-the-radar bilateral trade relationship suddenly became a focal point of tariff threats, strategic negotiations, and high-level political engagement. According to the latest US import data & Indonesia export data, the total value of US imports from Indonesia reached $29.54 billion in 2024. Meanwhile, US exports to Indonesia accounted for $10.20 billion in 2024, as per the US export data. The total value of US-Indonesia trade reached $39.74 billion in 2024 and $35.58 billion in the first three quarters of 2025. Ongoing debates over the US tariff on Indonesia have drawn attention to the broader Indonesia trade deficit with US, prompting discussions on whether an Indonesia trade deal with US could ease tariff pressures, improve market access, and create a more balanced and strategic trade relationship as bilateral commerce between the two countries continues to grow.
The USA is the 2nd largest trade partner of Indonesia, as per the global trade data. With bilateral goods trade exceeding $38 billion annually and supply chains spanning electronics, footwear, palm oil, nickel, and energy products, even modest changes in trade policy now carry significant economic consequences. Indonesia is Southeast Asia’s largest economy and a core manufacturing and commodities hub. The United States remains one of Indonesia’s top export destinations, while Indonesia is an increasingly important supplier to U.S. consumers and manufacturers. In 2024 and early 2025, this relationship was tested by shifting U.S. trade policy priorities, Indonesia’s industrial policy ambitions, and broader geopolitical considerations.
This article examines US–Indonesia trade relations in depth using the most recent bilateral trade data from 2024 and early 2025. It then analyzes the evolving trade deal discussions of 2025, highlighting what is at stake for governments, exporters, investors, and supply chains on both sides.
Overview of Bilateral Trade: Scale and Direction (2024)
In 2024, total goods trade between the United States and Indonesia reached over $39 billion. The structure of this US-Indonesia trade relationship is asymmetric:
-
U.S. imports from Indonesia: roughly $29 billion
-
U.S. exports to Indonesia: roughly $10 billion
-
U.S. trade deficit with Indonesia: approximately $18 billion
This persistent U.S. trade deficit has been a defining feature of the relationship for more than a decade. While services trade partially offsets this imbalance, goods trade dominates the political and economic narrative.
From Indonesia’s perspective, the U.S. market is critical. The United States absorbs a significant share of Indonesia’s higher-value manufactured exports, particularly in footwear, electronics, and furniture. For the United States, Indonesia is both a consumer market of 280 million people and a key supplier of labor-intensive and resource-based goods that are difficult to source domestically.
Top Goods US Imports from Indonesia: What Does the US Import from Indonesia?
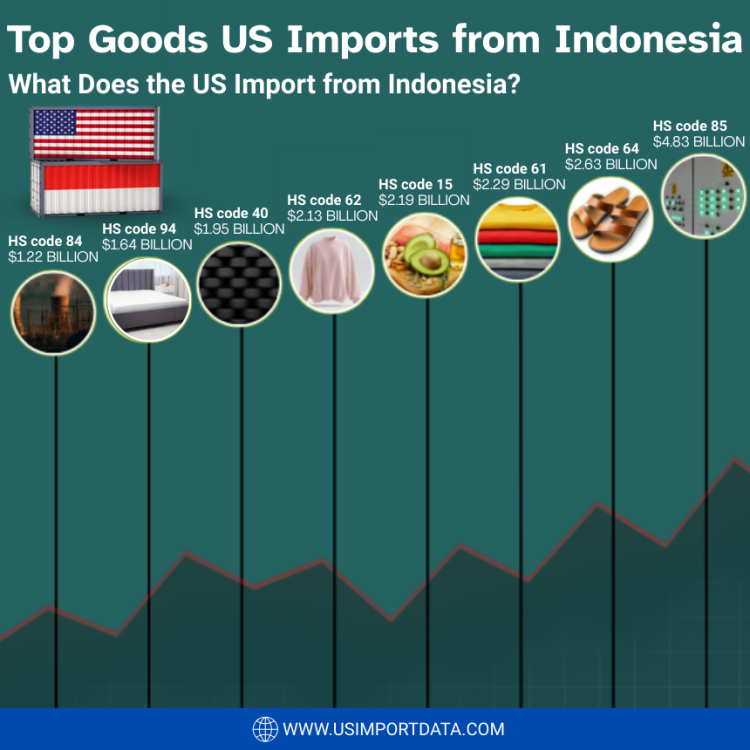
The United States imports various goods from Indonesia, demonstrating the mutually beneficial trade relationship between the two nations. Some of the top goods that the US imports from Indonesia include textiles, footwear, furniture, and electronics. These imports cater to a wide range of industries and consumer needs in the US market, showcasing the diverse offerings that Indonesia has to offer. The top 10 goods that the US imports from Indonesia, as per the US import statistics & US-Indonesia trade data for 2024-25, include:
1. Electrical machinery & equipment (HS code 85): $4.83 billion
Electrical machinery and equipment are among the top goods that the US imports from Indonesia. These products include everything from electric motors to generators and transformers. The total value of these imports amounts to $4.83 billion.
2. Footwear (HS code 64): $2.63 billion
Another significant import from Indonesia to the US is footwear. With a total import value of $2.63 billion, Indonesian footwear is in high demand in the US market, as per the data on US footwear imports from Indonesia by HS code. From sandals to sneakers, Indonesian footwear offers a wide variety of styles and designs.
3. Articles of apparel, knitted (HS code 61): $2.29 billion
Indonesian apparel, especially knitted garments, is also a popular import for the US market. With a total import value of $2.29 billion, these articles of apparel are both fashionable and affordable.
4. Animal or vegetable fats & oils (HS code 15): $2.19 billion
Animal or vegetable fats and oils are essential ingredients in many food and cosmetic products. Indonesia is a significant exporter of these products to the US, with a total import value of $2.19 billion.
5. Articles of apparel, not knitted (HS code 62): $2.13 billion
In addition to knitted garments, non-knitted apparel is also a significant import from Indonesia to the US. With a total import value of $2.13 billion, Indonesian clothing is known for its quality and style.
6. Rubber & articles thereof (HS code 40): $1.95 billion
Rubber and rubber articles are important imports from Indonesia, as per the data on US rubber imports from Indonesia. With a total import value of $1.95 billion, Indonesian rubber products are used in various industries, including automotive and construction.
7. Furniture, bedding, & mattresses (HS code 94): $1.64 billion
Furniture, bedding, and mattresses from Indonesia are also popular imports in the US market. With a total import value of $1.64 billion, Indonesian furniture is known for its craftsmanship and durability.
8. Nuclear reactors & machinery (HS code 84): $1.22 billion
Nuclear reactors and machinery are another significant import from Indonesia to the US. With a total import value of $1.22 billion, these products play a crucial role in various industries, including energy and manufacturing.
9. Fish & seafood (HS code 03): $1.14 billion
As an archipelago, Indonesia is rich in marine resources, making fish and seafood a valuable export to the US. With a total import value of $1.14 billion, Indonesian fish and seafood products are highly sought after for their freshness and quality.
10. Articles of leather (HS code 42): $910.46 million
Finally, articles of leather are also a significant import from Indonesia to the US. With a total import value of $910.46 million, Indonesian leather products are known for their craftsmanship and durability.
Top Products US Exports to Indonesia: What Does the US Export to Indonesia
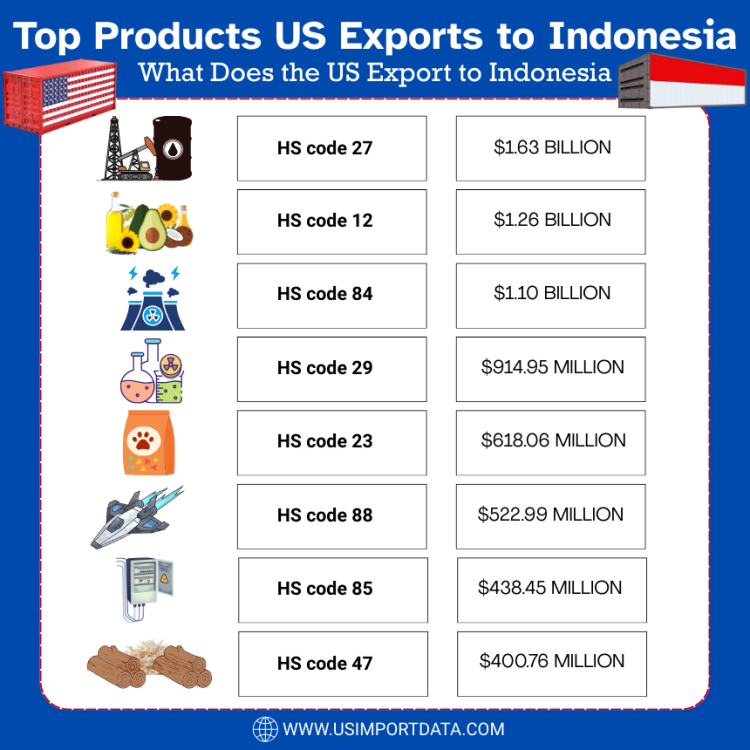
The United States exports a variety of products to Indonesia, showcasing a diverse trade relationship between the two countries. Some of the top products the US exports to Indonesia include machinery, aircraft, medical equipment, soybeans, and electrical machinery. These exports contribute significantly to the economic ties between the nations, strengthening bilateral trade and fostering cooperation in various sectors. The top 10 products that the US exports to Indonesia, as per the US shipment data for 2024-25, include:
1. Mineral fuels & oils (HS code 27): $1.63 billion
Mineral fuels and oils are the top products that the US exports to Indonesia. With an export value of $1.63 billion, this category includes a range of petroleum products, including crude oil, gasoline, and diesel fuel. Indonesia's growing energy needs make this a lucrative market for US exporters in the mineral fuels and oils sector.
2. Oil seeds & oleaginous fruits (HS code 12): $1.26 billion
Oil seeds and oleaginous fruits are another significant export category for the US in Indonesia. With an export value of $1.26 billion, this category includes products such as soybeans, sunflower seeds, and palm oil. These products are essential for Indonesia's food and agriculture industry, making them in high demand.
3. Nuclear reactors & machinery (HS code 84): $1.10 billion
Nuclear reactors and machinery are also among the top products that the US exports to Indonesia. With an export value of $1.10 billion, this category includes equipment and machinery used in nuclear power plants, as well as other industrial machinery. Indonesia's growing infrastructure and energy needs drive the demand for these products.
4. Organic chemicals (HS code 29): $914.95 million
Organic chemicals are another key export category for the US in Indonesia. With an export value of $914.95 million, this category includes a wide range of chemicals used in various industries, such as pharmaceuticals, agriculture, and manufacturing. Indonesia's diverse economy creates a strong demand for these chemicals.
5. Prepared animal food (HS code 23): $618.06 million
Prepared animal food is another important product that the US exports to Indonesia, as per the data on US animal food exports to Indonesia by HS code. With an export value of $618.06 million, this category includes feed and supplements for livestock and pets. Indonesia's growing agricultural sector and increasing demand for meat products drive the need for prepared animal food imports.
6. Aircraft, spacecraft, & parts thereof (HS code 88): $522.99 million
Aircraft, spacecraft, and parts thereof are significant export products for the US in Indonesia. With an export value of $522.99 million, this category includes airplanes, helicopters, and various aerospace components. Indonesia's growing air transportation industry makes this a lucrative market for US exporters in the aerospace sector.
7. Electrical machinery & equipment (HS code 85): $438.45 million
Electrical machinery and equipment are also among the top products that the US exports to Indonesia. With an export value of $438.45 million, this category includes a wide range of electrical appliances, components, and equipment. Indonesia's expanding infrastructure and technology sectors drive the demand for these products.
8. Pulp of wood (HS code 47): $400.76 million
Pulp of wood is another key export product for the US in Indonesia. With an export value of $400.76 million, this category includes wood pulp used in the production of paper and packaging materials. Indonesia's growing paper and packaging industry creates a strong demand for wood pulp imports.
9. Optical, medical, surgical instruments (HS code 90): $271.24 million
Optical, medical, and surgical instruments are essential export products for the US in Indonesia. With an export value of $271.24 million, this category includes a range of medical devices, equipment, and instruments. Indonesia's healthcare sector relies on these imports to meet the growing demand for quality medical services.
10. Dairy products (HS code 04): $214.75 million
Dairy products are also among the top products that the US exports to Indonesia. With an export value of $214.75 million, this category includes milk, cheese, butter, and other dairy products. Indonesia's growing population and changing dietary preferences create a significant market for US dairy exporters.
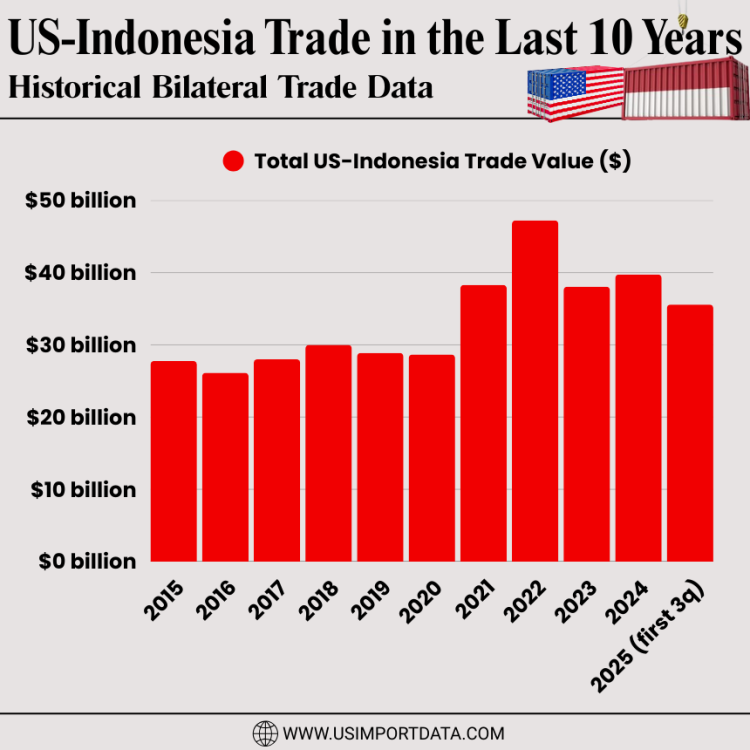
US-Indonesia Trade in the Last 10 Years: Historical Bilateral Trade Data
|
Year of Trade |
Total US-Indonesia Trade Value ($) |
|
2015 |
$27.76 billion |
|
2016 |
$26.14 billion |
|
2017 |
$28 billion |
|
2018 |
$29.98 billion |
|
2019 |
$28.87 billion |
|
2020 |
$28.66 billion |
|
2021 |
$38.30 billion |
|
2022 |
$47.24 billion |
|
2023 |
$38.04 billion |
|
2024 |
$39.74 billion |
|
2025 (first 3 quarters) |
$35.58 billion |
Composition of Indonesian Exports to the United States
Indonesia’s exports to the U.S. are relatively concentrated. A limited number of sectors account for the majority of export value, making them especially sensitive to tariff and regulatory changes.
1. Electronics and Electrical Machinery
Electronics represent one of Indonesia’s fastest-growing export categories to the United States. This includes:
-
Electrical components
-
Consumer electronics
-
Telecommunications equipment
-
Semiconductor-related components
While Indonesia is not a top-tier semiconductor manufacturer, it plays an important role in assembly, testing, and midstream electronics production. Growth in this category reflects both U.S. demand diversification away from China and Indonesia’s efforts to attract electronics manufacturing investment.
2. Footwear and Apparel
Footwear is one of Indonesia’s most valuable manufactured exports to the U.S. The country is a major global production base for athletic shoes, casual footwear, and private-label brands sold in the U.S. market.
Key characteristics of this sector include:
-
High labor intensity
-
Thin profit margins
-
Strong sensitivity to tariffs
Even modest tariff increases can significantly affect sourcing decisions by U.S. brands and retailers. Apparel and textiles, while smaller than footwear, face similar dynamics.
3. Palm Oil and Processed Agricultural Products
Palm oil and palm-based derivatives are central to Indonesia’s agricultural exports. Shipments to the United States include:
-
Refined palm oil
-
Oleochemicals
-
Food ingredients
-
Industrial inputs
Although the U.S. is not Indonesia’s largest palm oil customer globally, it is an important premium market. Trade barriers or sustainability-related restrictions in this sector can have ripple effects across Indonesia’s rural economy.
4. Rubber, Furniture, and Fisheries
These sectors form the “middle tier” of Indonesian exports:
-
Natural rubber and rubber products
-
Wooden furniture and home furnishings
-
Shrimp, tuna, and other seafood products
They are diversified, employment-intensive industries that benefit from stable access to the U.S. market but lack the scale to easily absorb shocks from sudden tariff increases.
5. Nickel and Mineral-Based Products
Indonesia is the world’s dominant nickel producer, and exports of processed nickel products increased sharply in 2024 and early 2025. While the U.S. is not the largest destination, U.S. demand is rising due to:
-
Electric vehicle supply chains
-
Battery manufacturing
-
Energy transition policies
Indonesia’s push to move up the value chain through domestic processing has trade implications that intersect with U.S. industrial and climate strategies.
The 2025 Turning Point: Tariffs and Negotiations
The Tariff Shock
In early 2025, the U.S. government signaled its intent to impose higher tariffs on a range of Indonesian goods. The measures were framed as part of a broader push to rebalance trade relationships and secure stronger market access for U.S. exporters.
The announcement triggered immediate concern in Indonesia. Export-oriented industries warned of:
-
Reduced competitiveness in the U.S. market
-
Job losses in labor-intensive sectors
-
Disruption to long-established supply chains
Front-Loading and Trade Distortions
One immediate effect was front-loading of exports. Indonesian firms accelerated shipments to the U.S. in early 2025 to avoid potential tariff hikes. This temporarily boosted export volumes but also distorted monthly trade data and inventory patterns.
Such behavior is common during trade disputes and often followed by a sharp correction once tariffs are implemented or negotiations conclude.
The July 2025 Leaders’ Understanding
In July 2025, senior leaders from both countries announced a high-level understanding aimed at de-escalating the tariff dispute and laying the groundwork for a broader trade framework.
Although not a formal free trade agreement, the understanding outlined several core elements:
-
Tariff Reductions
-
Indonesia would eliminate or sharply reduce tariffs on most U.S. goods.
-
The U.S. would apply reduced tariffs, rather than punitive rates, to key Indonesian exports.
-
Market Access Commitments
-
Improved access for U.S. agricultural and industrial exports.
-
Greater transparency in Indonesian import licensing and standards.
-
Regulatory Cooperation
-
Dialogue on non-tariff barriers.
-
Alignment in select technical and customs procedures.
-
Strategic Cooperation
-
Energy transition
-
Critical minerals
-
Supply chain resilience
This announcement stabilized markets and eased immediate fears of a trade war.
Why the US-Indonesia Trade Deal Became Fragile
Following the political announcement, negotiators began the complex process of translating commitments into legal text. This phase exposed big differences.
Key Points of Friction
-
Non-tariff barriers: The U.S. sought binding commitments; Indonesia preferred flexible language.
-
Industrial policy: Indonesia resisted provisions that could constrain its downstream processing and local content strategies.
-
Future trade agreements: Proposed notification or consultation clauses raised sovereignty concerns in Jakarta.
By late 2025, negotiations slowed, and officials on both sides publicly acknowledged the risk that the deal could unravel.
Economic Implications of a Successful Trade Deal
If finalized and implemented, a US–Indonesia trade deal would reshape bilateral commerce in several ways:
For Indonesian Exporters
-
Improved certainty for footwear, electronics, and palm oil exporters
-
Preservation of U.S. market access under reduced tariffs
-
Incentives to upgrade production and compliance standards
For U.S. Exporters
-
Lower barriers to a large and growing consumer market
-
Stronger positioning against competitors from Asia and Europe
-
Better access to infrastructure and energy projects
For Investors
-
Increased confidence in supply chains linking Southeast Asia and the U.S.
-
Opportunities in nickel processing, renewables, and manufacturing
-
Reduced policy volatility
Risks if the Deal Collapses
Failure to conclude the deal would also carry real costs:
-
Higher U.S. tariffs on Indonesian goods
-
Reduced competitiveness for Indonesian exporters
-
Diversion of trade toward alternative markets
-
Chilling effect on foreign investment
-
Increased politicization of trade relations
For U.S. consumers, higher tariffs could translate into higher prices for footwear, furniture, and consumer electronics.
Strategic Context: Beyond Trade Numbers
US–Indonesia trade relations in 2025 are about more than exports and imports. They sit at the intersection of:
-
Supply chain diversification away from China
-
Energy transition and critical minerals
-
Regional influence in Southeast Asia
-
Competing models of industrial policy
Indonesia is asserting its role as a resource-rich, manufacturing-capable economy with policy autonomy. The United States is seeking reliable partners while protecting domestic industries and strategic interests.
What to Watch Going Forward
As 2026 approaches, several indicators will signal the direction of the relationship:
-
Publication of final tariff schedules
-
Legal language on non-tariff barriers
-
Implementation timelines and phase-ins
-
Changes in monthly trade volumes
-
Investment announcements tied to the deal
Businesses should plan for multiple scenarios rather than assuming a single outcome.
Conclusion: A Trade Relationship at a Crossroads
In conclusion, the US–Indonesia trade relations in 2025 reflect a broader shift in global trade. The data from 2024 and early 2025 shows a deep, valuable, but imbalanced relationship. The attempted trade deal represents an effort to modernize that relationship without fully committing to a traditional free trade agreement.
Whether the deal ultimately succeeds or fails, one conclusion is clear: the economic ties between the United States and Indonesia are now too large, too strategic, and too interconnected to remain politically quiet. Trade policy will continue to shape investment, employment, and supply chains on both sides for years to come.
We hope that you liked our interactive blog report on the US-Indonesia trade relations 2025. For more information on the latest US trade data, or to search live US import-export data by country, visit USImportdata. Contact us at info@tradeimex.in for customized trade reports and market insights.
What's Your Reaction?