US Urea Imports Data by HS Code 3102: Latest Import Statistics & USA Urea Buyers Database
Get the latest US urea imports by HS Code 3102 data, including verified urea import data, top urea buyers in USA, & leading urea importers in the US.
Introduction: Why Urea Imports Matter in the U.S. Market
Urea (classified under HS Code 3102) is one of the world’s most widely traded nitrogenous fertilizers. It serves a critical role in agriculture, animal feed, industrial chemicals, and resin production. For importers, understanding urea flows, sources, and trends in the U.S. helps with strategic sourcing, forecasting pricing, and supply chain planning. According to the latest US import data and Urea import data of the USA, the total value of US urea imports reached $1.86 billion in 2024, a 7% decline from the previous year. According to the US urea import data by HS code 3102, the US imported urea worth $2.02 billion in the first 11 months of 2025. Yes, the United States is a significant player in global fertilizer trade, and does the US import urea is a common query with a clear answer, yes, the country imports large volumes to meet agricultural demand. In fact, the US is among the major urea importing countries, with imports valued at around $1.86 billion in 2024, sourced mainly from Russia, Qatar, Canada, and Saudi Arabia.
The USA is the 3rd largest importer of urea in the world, as per the global trade data. Global production capacity, supply chain disruptions, geopolitics, and domestic fertilizer demand all influence U.S. urea imports. Based on the latest trade data through 2024–2025, we can identify key trends in the American urea import volume, value, major source countries, shifts over time, and the U.S. importer landscape.
HS Code 3102: The Trade Classification Explained
HS Code 3102 falls under the Harmonized System and covers:
-
Urea, whether or not in aqueous solution, including industrial grades and agricultural fertilizer grades.
The specific 6-digit sub-headings of Urea HS code often include:
-
310210 – Urea
-
310221 – Urea, in aqueous solution
-
Other subcategories, depending on purity or industrial specifications
For U.S. import data, most trade records and statistics focus on 310210 (urea in non-aqueous form), which represents the bulk of shipments.
Latest US Urea Import Statistics: Value & Volume
Annual Import Totals (2024)
According to the US trade database:
-
Total U.S. urea imports (HS 310210):
– Value: $1.87 billion USD
– Quantity: 5.10 billion kilograms (metric tons) -
Major source countries (ranked by value) include:
– Russian Federation: $457.5M (1.29B kg)
– Qatar: $362.1M (1.04B kg)
– Canada: $250.4M (559M kg)
– Saudi Arabia: $161.1M (484M kg)
– Algeria: $156.9M (456M kg) -
Additional exporters include Nigeria, Oman, the UAE, Egypt, Trinidad and Tobago, and various European countries such as Germany, as per the data on US urea imports from Germany.
This import mix reflects global urea production hubs outside the United States and a diversified dependence on Middle Eastern, African, and North American suppliers.
Interpretation: Although urea is produced domestically by some U.S. chemical companies, the country still relies heavily on imports due to price competitiveness, seasonal demand, and capacity constraints. The concentration of imports from Russia and Qatar reflects global shipping economics and fertilizer market linkages.
Historical Comparison: 2022 vs. 2024 Trends
Comparing 2024 with earlier years highlights import dynamics:
-
In 2022, U.S. imports were significantly higher in value ($3.23 billion USD) and similar in quantity (5.34B kg). Primary sources were Qatar, Oman, Russia, and Canada.
Key takeaway from historical data:
-
2024 valuations dropped by 40% compared to 2022, suggesting either price softening, changes in tariff/duty structures, or supply chain shifts.
-
Import volumes remained relatively stable, implying steady demand, but volatile price per ton drivers (e.g., global fertilizer pricing shifts, energy costs, currency movements).
US Urea Imports by Country: Where Does the US Import Urea From?
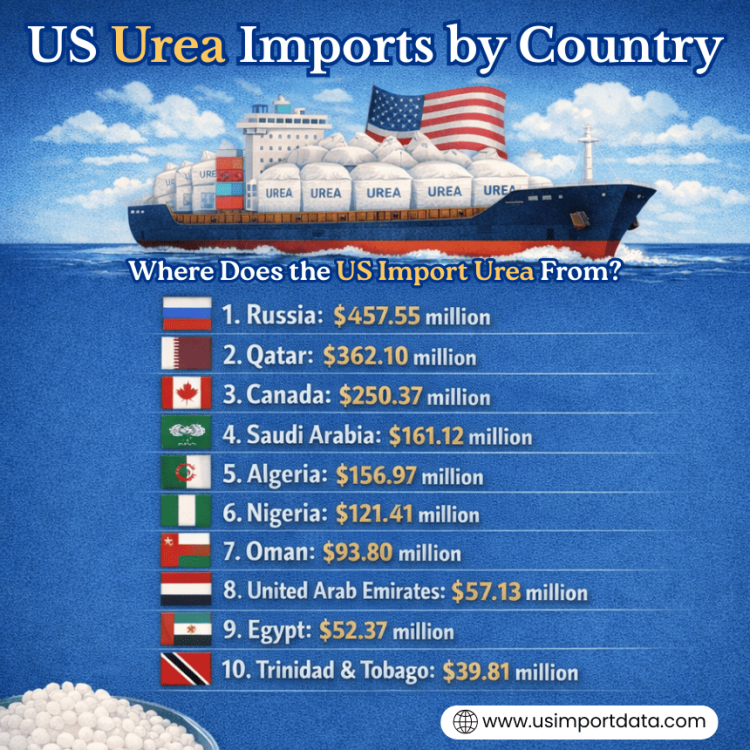
US Urea imports play a significant role in meeting the demand for fertilizers in the United States. The US imports Urea primarily from countries such as Canada, Russia, and Qatar, as per the data on US urea imports by country. These imports help ensure a stable supply of Urea for agricultural purposes within the US market. It is essential for the production of fertilizers, and the US relies on various countries to meet its urea demand. The top 10 urea supplier countries to the USA, as per the US urea shipment data for 2025, include:
1. Russia: $457.55 million (24.5%)
Russia holds the top position as a significant urea exporter to the US, accounting for 24.5% of the total urea imports, as per the data on Russia urea exports to the US by HS code. The country's vast production capacity and strategic geographical location make it a key player in supplying urea to meet the US agricultural needs.
2. Qatar: $362.10 million (19.4%)
Qatar closely follows Russia as another crucial player in the US urea import market, contributing 19.4% of the total imports. The country's advanced urea production facilities and strong trade relations with the US make it a reliable source of urea for American farmers.
3. Canada: $250.37 million (13.4%)
Canada's proximity to the US and its well-established agricultural industry make it a significant supplier of urea, accounting for 13.4% of the total US imports. The strong bilateral trade relationship between the two countries ensures a steady supply of urea for US farmers.
4. Saudi Arabia: $161.12 million (8.6%)
Saudi Arabia plays a crucial role in the US urea import market, contributing 8.6% of the total imports. The country's high-quality urea production facilities and reliable supply chain make it a preferred source of urea for US agricultural purposes.
5. Algeria: $156.97 million (8.4%)
Algeria is another key player in the US urea import market, accounting for 8.4% of the total imports. The country's competitive pricing and high-quality urea products make it a popular choice for US importers looking to meet their agricultural needs.
6. Nigeria: $121.41 million (6.5%)
Nigeria's growing urea production capacity and competitive pricing have made it a significant player in the US urea import market, contributing 6.5% of the total imports. The country's strategic location and focus on agricultural exports make it an attractive source of urea for US buyers.
7. Oman: $93.80 million (5%)
Oman's strategic geographical location and advanced urea production facilities have positioned it as a key player in the US urea import market, accounting for 5% of the total imports. The country's efficient supply chain and high-quality products make it a reliable source of urea for US agricultural purposes.
8. United Arab Emirates: $57.13 million (3.1%)
The United Arab Emirates is another important contributor to the US urea import market, accounting for 3.1% of the total imports. The country's modern production facilities and strong trade relations with the US ensure a steady supply of urea to meet the agricultural demands of American farmers.
9. Egypt: $52.37 million (2.8%)
Egypt's growing urea production capacity and competitive pricing have made it a notable player in the US urea import market, contributing 2.8% of the total imports. The country's focus on agricultural exports and quality products makes it a reliable source of urea for US buyers.
10. Trinidad & Tobago: $39.81 million (2.1%)
Trinidad & Tobago wraps up the list of top countries from which the US imports urea, accounting for 2.1% of the total imports. The country's strong trade relations with the US and focus on supplying high-quality urea products make it a valuable source of urea for American farmers.
Growth & Diversification Trends:
-
Imports from Africa (e.g., Nigeria, Algeria) and the Middle East have been rising.
-
Imports from North America (Canada) remain significant due to proximity and trade agreements.
-
Asian sources like Malaysia and European countries also contribute smaller but meaningful quantities.
U.S. Urea Buyers Database: Top Urea Importers in USA With Shipment Records
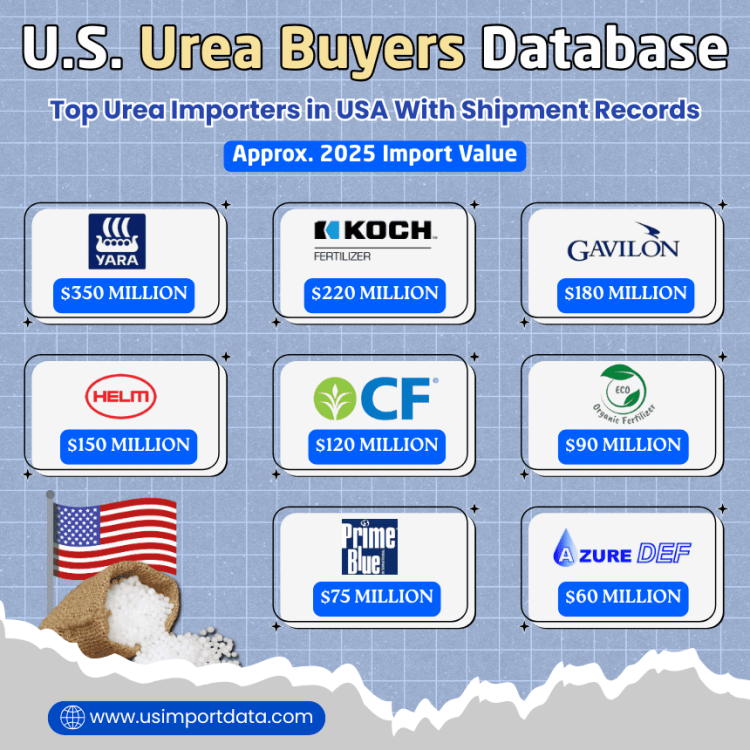
Obtaining an accurate business database is critical for suppliers and traders. Although comprehensive proprietary databases are often subscription-based, publicly available shipment data showcases verified fertilizer importers in USA. This creates strong demand for urea importers in USA, including agricultural distributors and fertilizer companies that supply farms nationwide. As a result, urea buyers in USA actively rely on global suppliers to maintain consistent availability, making the US a key destination in the international urea trade network. The leading urea buyers & importers in the USA, as per the US urea buyers data & importer statistics for 2025, include:
|
Rank |
Company Name |
Approx. 2025 Import Value |
Top Import Types |
Top Import Source Countries |
|
1 |
$350 million |
Granular urea, industrial nitrogen products |
Qatar, Russia |
|
|
2 |
Koch Fertilizer LLC |
$220 million |
Bulk/Granular urea fertilizer |
Qatar, Canada |
|
3 |
Gavilon Fertilizer LLC |
$180 million |
Urea and blended nitrogen products |
Russia, Indonesia |
|
4 |
Helm Fertilizer Corporation |
$150 million |
Urea ammonium nitrate (UAN) and urea blends |
Trinidad & Tobago, Belgium |
|
5 |
CF Industries Holdings, Inc. |
$120 million |
Urea & nitrogen inputs (import/distribution) |
Canada, Qatar |
|
6 |
ECO Fertilizer Company |
$90 million |
Urea prills and technical feedstock |
Russia, Netherlands |
|
7 |
Prime Blue International |
$75 million |
Agricultural urea products |
Russia, Egypt |
|
8 |
AZURE DEF |
$60 million |
Urea 46 (agricultural grade) |
Mexico, Russia |
|
9 |
SQM Comercial de Mexico, S.A |
$50 million |
Prilled urea, specialty blends |
Mexico, Chile |
|
10 |
CHS Inc. |
$25 million |
Granular urea & solutions |
Canada, Algeria |
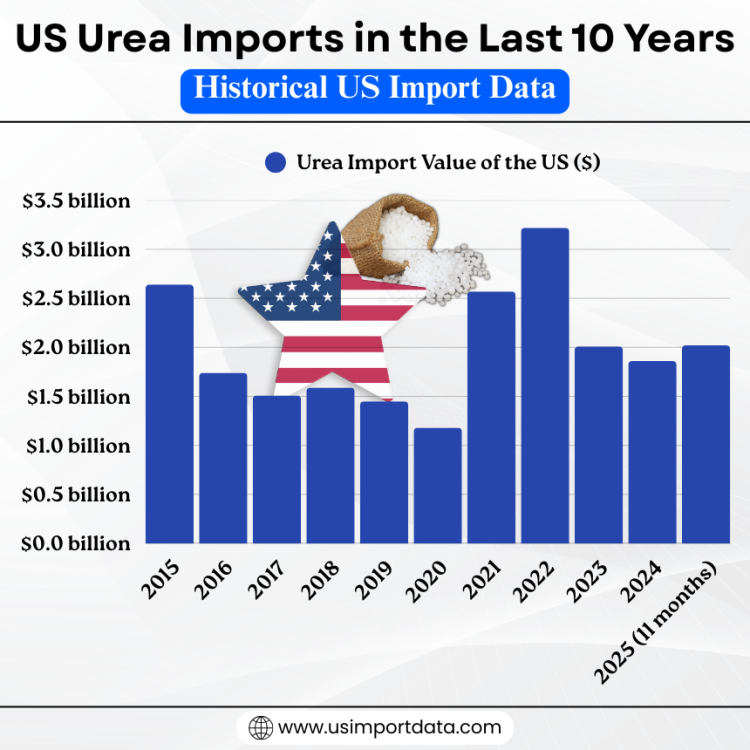
US Urea Imports in the Last 10 Years: Historical US Import Data
|
Year of Imports |
Urea Import Value of the US ($) |
|
2015 |
$2.64 billion |
|
2016 |
$1.74 billion |
|
2017 |
$1.51 billion |
|
2018 |
$1.59 billion |
|
2019 |
$1.45 billion |
|
2020 |
$1.18 billion |
|
2021 |
$2.57 billion |
|
2022 |
$3.22 billion |
|
2023 |
$2.01 billion |
|
2024 |
$1.86 billion |
|
2025 (11 months) |
$2.02 billion |

Import Shipment Activity (2024–2025): Macro Picture
According to trade database indicators:
-
About 4,500+ urea import shipments were recorded in the United States for the trailing 12 months (through late 2025).
-
These shipments came from 55 exporting countries.
-
There are an estimated 600+ verified global buyers and 720+ suppliers linked to these shipments.
The high number of shipments and trade participants underscores:
-
Strong import demand across regional supply chains.
-
Fragmented buyer landscape, many companies import smaller quantities.
-
Ample opportunities for new suppliers to engage with different buyers.
US Urea Import Patterns: Seasonal & Strategic Drivers
1. Fertilizer Demand Cycles
Urea imports typically peak ahead of:
-
Spring planting (Q1–Q2)
-
Autumn fertilizer preparation (Q3–Q4)
This pattern reflects U.S. agricultural demand cycles, global fertilizer pricing, and shipping lead times.
2. Price & Energy Cost Influence
Urea prices are sensitive to:
-
Natural gas prices (key input)
-
Shipment rates
-
Currency exchange rates
Decreases in import value (e.g., 2024 vs. 2022) may signal lower global urea prices rather than reduced import volumes.
3. Geopolitical & Trade Regulation Factors
Global trade shifts, such as export controls, sanctions, or regional fertilizer production changes, affect supply availability. For example:
-
Adjustments to tariffs or duties on certain trading partners
-
Environmental or export policies in producer countries
Though specific urea tariff updates in 2025 are not widely publicized as of early 2026, macro trade policy continues influencing flows.
Competitive Landscape in U.S. Urea Importing
Buyer Types
U.S. urea buyers can include:
-
Agricultural commodity traders
-
Fertilizer distribution companies
-
Bulk chemical importers
-
Industrial resin manufacturers
Each buyer segment has different volume requirements, quality specifications, and contractual preferences.
Supplier Opportunity Mapping
For exporters, understanding buyer needs and positioning product offerings, whether prilled, granular, or industrial grade, can improve market entry. Typical competitive factors include:
-
Price competitiveness
-
Lead time and trade capability
-
Product specification compliance
-
Trade finance abilities
Practical Takeaways for Industry Participants
For Exporters / Suppliers
-
Target diversified supply countries, and buyers in the U.S. source from a wide roster of producers.
-
Quality and traceability matter, especially for agricultural users.
-
Leveraging trade data platforms helps identify high-volume buyers and recurring shipment patterns.
For Importers
-
Monitor global price signals (natural gas, freight rates).
-
Use importer databases to benchmark suppliers and optimize procurement.
-
Plan shipments around seasonal peaks to reduce inventory costs.
Conclusion: What the Data Tells Us About U.S. Urea Imports
Based on the most recent trade statistics, we can conclude that:
-
Urea remains a significant import commodity for the U.S., with billions of kilograms imported annually under HS Code 3102.
-
Import value has fluctuated, likely due to global price dynamics and supply conditions.
-
Major source countries remain diversified, spanning Russia, Qatar, Canada, and the Middle East.
-
Shipment activity indicates robust demand, with thousands of shipments annually and hundreds of buyers.
-
Exporter and buyer databases provide actionable business leads for market participants.
For companies operating in fertilizer, chemical sourcing, and global trade, this data informs strategic planning, risk assessment, and growth opportunities in the U.S. urea import sector.
Want US Urea Shipment Data or a Full Buyer Database?
If you need ongoing urea import shipment reports, HS code filtering, or verified trade details for U.S. buyers, consider pulling data from USImportdata and get the latest US export-import data or search live data on US urea imports by country. Contact us at info@tradeimex.in for customized trade reports, a verified US urea importers database & market insights.
What's Your Reaction?