US-Japan Trade Deal: Understanding the Trade Deficit & Top US Imports from Japan
Explore the US trade deficit with Japan, Japan’s trade surplus with the US, and key insights into US–Japan bilateral trade trends, exports, imports, and economic ties.
Introduction
The United States and Japan share one of the world’s most enduring and important economic relationships. Beyond being allies in security, their economies are intertwined through goods trade, services, investment, and technology collaboration, which led to the recent US-Japan trade deal. Yet a familiar tension persists: the U.S. consistently runs a large goods trade deficit with Japan. This imbalance has been a point of political friction for decades, from the trade wars of the 1980s to the tariff negotiations of 2025. According to the US import data and Japan export data, the total value of US imports from Japan reached $152.06 billion in 2024 and $76.84 billion in the first two quarters of 2025. The US exports to Japan accounted for $79.74 billion in 2024 and $40.45 billion in the first two quarters of 2025, as per the US export data and Japan import data. Japanese trade with US has long been shaped by shifting economic priorities, and discussions about Japan America trade often highlight how both nations balance competition with cooperation.
Recent negotiations suggest that a modernized Japan USA trade deal could strengthen supply chains, support technological collaboration, and enhance overall stability in the Indo-Pacific economy. Understanding what does the US import from Japan provides insight into the economic relationship between the two countries, especially as the US trade deficit with Japan continues to reflect America’s high demand for Japanese goods. This imbalance also contributes to the persistent Japan trade surplus with US, driven by strong exports of automobiles, electronics, machinery, and advanced technology. When examining what does Japan export to the US, it becomes clear that high-value manufactured products dominate the trade flow, shaping one of the most important bilateral trade partnerships in the global economy.
According to the latest US trade data & US-Japan trade statistics, the total bilateral trade between the US and Japan reached $231.8 billion in 2024 and $117.29 billion in H1 2025. Japan is ranked as the 3rd largest trade partner of the US, as per the global trade data. Japan and the United States have a substantial goods trade deficit, which was approximately $69.4 billion in 2024. The U.S. buys more goods from Japan than it exports, with electronics, auto parts, and cars being major imports. This results in an imbalance. Recent trade policies, such as a new tariff framework and more Japanese investments into the U.S. economy, are addressing this imbalance, which has been a point of trade conflict.
In 2024–25, this issue returned to center stage. U.S. imports from Japan, dominated by automobiles, machinery, and advanced electronics, far exceed U.S. exports in return. Policymakers in Washington have sought to address the deficit through tariffs, reciprocal access measures, and investment commitments. Tokyo, meanwhile, has aimed to preserve access for its export champions while opening its markets just enough to keep relations stable. This article offers a detailed, data-driven look at the US–Japan trade deal, trade deficit, the major categories of U.S. imports from Japan, and the 2025 trade deal that reshaped tariffs and investment flows.
The US–Japan Trade Deal 2025
After months of negotiations, a new Strategic Trade and Investment Agreement between the United States and Japan was finalized in September 2025. Driven by U.S. tariffs earlier in the year, the agreement specifies reciprocal pledges on market access, tariffs, and a substantial Japanese venture into the U.S. The trade talks that culminated in mid-2025 were some of the most consequential in recent U.S.–Japan economic history. After months of escalating tariff threats, both sides reached a compromise deal designed to protect their key industries while averting a damaging trade war. The agreement struck a balance between Washington’s political demand for fairness and Tokyo’s determination to preserve access for its export-heavy economy.
Background and Negotiation Dynamics
In early 2025, the U.S. announced plans to impose steep tariffs, ranging from 25% to 27%, on Japanese automobiles and other goods, citing the persistent bilateral trade deficit and unfair market access barriers in Japan. Japan warned that such measures would severely disrupt trade flows, harm consumers, and strain the alliance. Negotiations moved quickly, with Japanese officials offering concessions in tariffs, investments, and agricultural access in exchange for avoiding punitive duties. By July 2025, the two governments unveiled a US-Japan framework agreement that stabilized tariffs at a lower level and introduced major investment commitments.
Key Features
In July 2025, the U.S. and Japan struck a trade deal aimed at recalibrating tariffs and addressing the imbalance without triggering a full-blown trade war. The major provisions included:
-
15% Reciprocal Tariffs: Instead of the 25–27% tariffs previously threatened, both sides agreed to set tariffs at 15% on a wide range of goods, including automobiles. This represented a compromise: higher than past levels but lower than the most punitive proposals.
-
$550 Billion Japanese Investment Commitment: Japan pledged to channel investments into U.S. industries such as semiconductors, metals, shipbuilding, pharmaceuticals, and energy infrastructure by 2029.
-
Tariff Caps on Sensitive Sectors: Key industries like pharmaceuticals and semiconductors were guaranteed no higher than 15% tariffs, ensuring predictable access.
-
Market Access Provisions: The agreement promised greater access for U.S. exports to Japan in areas such as automobiles, trucks, beef, and rice. While quotas remain in place for certain agricultural products, the symbolic opening matters for political optics.
-
Anti-Circumvention Rules: The deal included mechanisms to prevent double tariffs and to monitor trade diversion through third countries.
Implications
-
For U.S. Consumers and Importers: A 15% tariff increases costs, particularly for imported autos and machinery. Some of this may be passed on to U.S. consumers, raising vehicle prices. For intermediate goods, manufacturers may face higher input costs.
-
For Japanese Exporters: The compromise avoids crippling tariffs, but exporters lose some of their pricing advantage. Automakers may accelerate investment in U.S.-based production to mitigate tariff exposure.
-
For U.S. Exporters: Gains are more uncertain. While the deal promises expanded access, entrenched consumer preferences and regulatory standards in Japan may limit real market penetration, especially for U.S. vehicles.
-
For the Trade Deficit: The deficit may stabilize or narrow slightly if tariffs reduce import volumes and if Japanese investment boosts U.S. production capacity. However, structural factors suggest the imbalance will not disappear quickly.
Top 10 Goods the US Imports from Japan: US-Japan Goods Trade
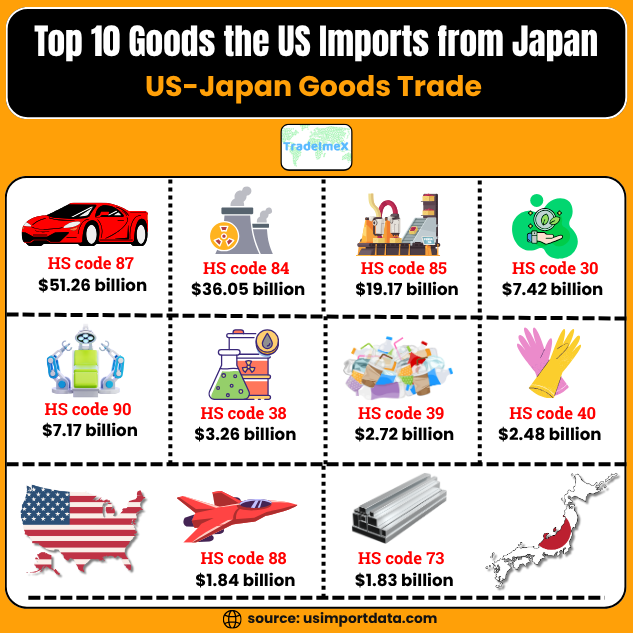
Japan is known for its high-quality products and innovative technology, which is why the US imports a variety of goods from Japan. The US imports a diverse range of goods from Japan, showcasing the strong trade relationship between the two countries. Some of the leading goods that the US imports from Japan include automobiles, electronic equipment, machinery, optical and medical instruments, and pharmaceutical products. This bilateral trade between the US and Japan not only contributes to their respective economies but also highlights the technological advancements and manufacturing expertise that Japan is known for on the global stage. The top 10 goods that the US imports from Japan, as per the US imports by country and the US shipment data for 2024-25, include:
1. Vehicles (HS code 87): $51.26 billion
One of the most significant imports from Japan to the US is vehicles, as per the data on US vehicle imports from Japan by HS code. Japanese car manufacturers like Toyota, Honda, and Nissan are well-known for their reliable and fuel-efficient vehicles. The US imports a wide range of cars, trucks, and motorcycles from Japan, making this the top category of imports.
2. Nuclear reactors and machinery (HS code 84): $36.05 billion
Another major import category is nuclear reactors and machinery. Japan is a global leader in the development of advanced technology, including nuclear power generation. The US imports a significant amount of machinery and equipment for various industries from Japan, contributing to the overall trade between the two countries, as per the data on US machinery imports from Japan.
3. Electrical machinery and equipment (HS code 85): $19.17 billion
Japan is also known for its high-quality electrical machinery and equipment. The US imports a wide range of products in this category, including semiconductors, telecommunication equipment, and home appliances. Japanese brands like Sony, Panasonic, and Toshiba are popular among American consumers, driving up the import numbers in this category.
4. Pharmaceutical products (HS code 30): $7.42 billion
Japanese pharmaceutical companies are known for their cutting-edge research and development in the healthcare industry. The US imports a significant amount of pharmaceutical products from Japan, including medications, vaccines, and medical devices. This category contributes to the overall health and well-being of the American population.
5. Optical, medical, or surgical instruments (HS code 90): $7.17 billion
Japan is also a leading producer of optical, medical, and surgical instruments. The US imports a variety of equipment in this category, including microscopes, cameras, and surgical tools. Japanese precision and attention to detail are highly valued in the medical field, making these products popular among healthcare professionals in the US.
6. Miscellaneous chemical products (HS code 38): $3.26 billion
Chemical products from Japan also make up a significant portion of US imports. From industrial chemicals to specialty materials, Japanese manufacturers supply a wide range of products to American industries. This category plays a vital role in supporting the manufacturing sector and overall economic growth in the US.
7. Plastics and articles thereof (HS code 39): $2.72 billion
Plastics and articles made from plastic are essential imports from Japan. The US relies on Japanese suppliers for a variety of plastic products, including packaging materials, components for electronics, and automotive parts. With an emphasis on sustainability and recyclability, Japanese plastic products are in high demand in the US market.
8. Rubber and articles thereof (HS code 40): $2.48 billion
Rubber products are another significant import category from Japan to the US. From tires to industrial rubber components, Japanese manufacturers provide high-quality products that meet the stringent standards of American consumers. The durability and performance of Japanese rubber products make them a preferred choice in various industries.
9. Aircraft, spacecraft, and parts thereof (HS code 88): $1.84 billion
Japan is also a key supplier of aircraft, spacecraft, and parts to the US. With a strong aerospace industry, Japanese companies manufacture a wide range of products, including components for commercial aircraft and satellites. The US imports these products to support its aviation and space exploration activities, strengthening the partnership between the two countries.
10. Articles of iron or steel (HS code 73): $1.83 billion
Iron and steel products from Japan are essential for various industries in the US. From construction materials to machinery components, Japanese manufacturers supply a wide range of iron and steel products that meet the quality standards of American companies. This category of imports plays a crucial role in supporting infrastructure development and manufacturing activities in the US.
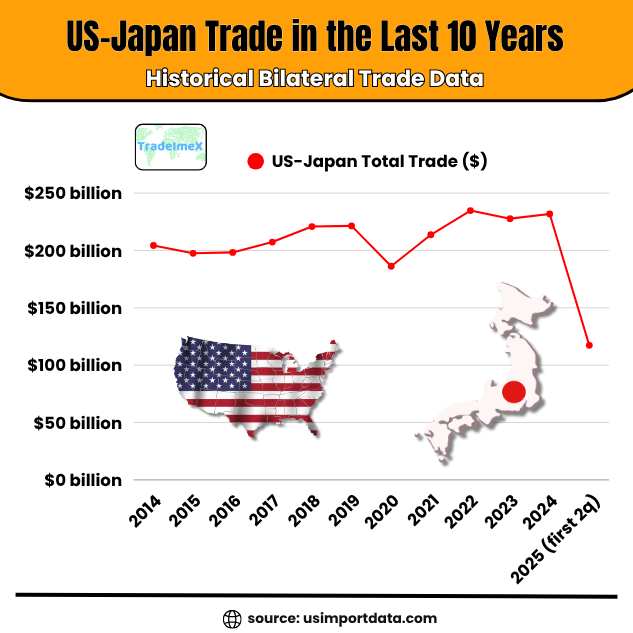
US-Japan Trade in the Last 10 Years: Historical Bilateral Trade Data
|
Year of Trade |
US-Japan Total Trade ($) |
|
2014 |
$204.32 billion |
|
2015 |
$197.48 billion |
|
2016 |
$198.31 billion |
|
2017 |
$207.32 billion |
|
2018 |
$220.82 billion |
|
2019 |
$221.41 billion |
|
2020 |
$186.22 billion |
|
2021 |
$213.67 billion |
|
2022 |
$234.75 billion |
|
2023 |
$227.74 billion |
|
2024 |
$231.80 billion |
|
2025 (first 2 quarters) |
$117.29 billion |
The U.S.–Japan Trade Balance in 2024
In 2024, the U.S. exported roughly $79 billion in goods to Japan, as per the data on US exports to Japan, while importing about $152 billion in goods from Japan. That left a goods trade deficit of nearly $69 billion. While this figure was slightly smaller than in 2023, it still represented one of the largest bilateral imbalances the U.S. has with any advanced economy.
The deficit looks smaller when accounting for services trade, where the U.S. runs a surplus. U.S. service exports to Japan (in areas such as finance, intellectual property licensing, education, and tourism) reached nearly $49 billion, compared with U.S. service imports of around $42 billion. This $7 billion services surplus partially offset the goods gap, but the net trade balance with Japan remained deeply negative.
Context matters here. The overall U.S. goods trade deficit with the world in 2024 exceeded $1.2 trillion, with China, the European Union, Mexico, and Vietnam all contributing significantly. Japan’s share of that total was meaningful but not dominant. Still, the size of the U.S.–Japan imbalance and its concentration in politically sensitive industries, especially automobiles, has ensured it remains a policy priority.
Why the Trade Deficit Exists: Structural Drivers
Understanding the U.S.–Japan trade deficit requires going beyond raw numbers. Several structural factors explain why the U.S. consistently imports far more from Japan than it exports.
1. Industrial Specialization
Japan holds strong comparative advantages in automobiles, precision machinery, robotics, and specialized electronics. These are high-value, capital-intensive industries where Japanese firms have built global reputations for quality and reliability. U.S. consumers and businesses demand these products in large volumes, ensuring steady imports.
By contrast, U.S. exports to Japan are concentrated in agricultural products (such as corn, beef, and soybeans), aerospace equipment, defense technology, and services. While significant, these exports are not enough to match the scale of imports in industrial goods.
2. The Automotive Sector
Automobiles are the single largest driver of the deficit. In 2024, Japanese auto and parts exports to the U.S. exceeded $55 billion. U.S. auto exports to Japan, however, were only around $2–3 billion. This asymmetry has persisted for decades. Even with Japanese automakers building factories in the U.S., cross-border trade in parts and finished vehicles remains heavily tilted toward imports.
3. Non-Tariff Barriers
Japan maintains strict safety, environmental, and technical standards that make it challenging for U.S. vehicles to gain traction in its market. Cultural preferences and brand loyalty also limit U.S. auto sales in Japan. Conversely, U.S. import rules have been more permissive, giving Japanese manufacturers relatively easy access to the American market.
4. Exchange Rates
Currency dynamics play a role. A weaker yen makes Japanese exports more affordable for U.S. consumers while making U.S. exports more expensive in Japan. Throughout 2024, the yen traded at historically weak levels, amplifying Japan’s export competitiveness.
5. Supply Chain Integration
Many U.S. imports from Japan are not final consumer goods but intermediate products used in manufacturing, such as specialized machine tools, semiconductor equipment, and optical instruments. Because U.S. firms depend on these inputs, reducing imports is difficult without undermining domestic production.
Top Product Categories U.S. Imports from Japan (2024-25)
The import profile tells the real story of the deficit. In 2024, the following categories dominated U.S. imports from Japan:
-
Automobiles and Vehicle Parts
-
Value: Over $51 billion in passenger vehicles, plus billions more in parts.
-
Share: Roughly one-third of total U.S. imports from Japan.
-
Brands like Toyota, Honda, Nissan, and Subaru remain fixtures in the U.S. market, particularly in segments such as hybrids, SUVs, and compact cars.
-
Machinery (including nuclear reactors and boilers)
-
Value: Around $36 billion.
-
This includes industrial robots, machine tools, turbines, and specialized equipment essential to manufacturing and energy production.
-
Electrical and Electronic Equipment
-
Value: About $19 billion.
-
Components range from semiconductor manufacturing tools to consumer electronics parts and batteries. Japanese firms still dominate in certain niches such as image sensors and precision capacitors.
-
Pharmaceuticals
-
Value: Roughly $7.4 billion.
-
Japanese companies like Takeda and Astellas supply advanced medicines and biologics to the U.S. healthcare system.
-
Optical, Medical, and Precision Instruments
-
Value: Around $7.2 billion.
-
Includes imaging technology, diagnostic devices, and precision measurement tools.
-
Chemicals and Plastics
-
Combined value: More than $6 billion.
-
Specialized chemicals and plastics feed into industrial supply chains.
Collectively, these categories account for the majority of U.S. imports from Japan. The dominance of autos, machinery, and electronics is particularly striking; together, they make up nearly two-thirds of all imports.
Risks and Challenges of the US-Japan Trade Deal
-
Inflationary Pressures: Higher tariffs could contribute to price inflation in the U.S., particularly for cars and industrial equipment.
-
Limited Market Gains in Japan: U.S. exporters face barriers beyond tariffs, including cultural preferences and regulatory hurdles. Gains in access may be slower than expected.
-
Trade Diversion: Japanese firms could reroute production through third countries to avoid tariffs, complicating enforcement.
-
Political Volatility: Trade policy is subject to shifts in U.S. domestic politics. A change in administration or Congressional pressure could alter tariff rates again.
-
Global Factors: Exchange rate movements, energy prices, or geopolitical shocks could reshape trade patterns independent of the deal.
Outlook: 2025–2030
Looking ahead, three broad scenarios are possible:
-
Stabilization: The deficit remains roughly where it is today, as tariffs dampen import growth while Japanese investment builds U.S. production capacity.
-
Gradual Narrowing: Over several years, expanded U.S. exports and localized production have reduced the imbalance, though the deficit likely persists at tens of billions annually.
-
Persistent Deficit: If Japanese firms absorb tariffs and maintain competitiveness, and if U.S. exporters fail to gain meaningful access to Japan, the imbalance continues with little change.
The most likely outcome is stabilization with modest narrowing. The deal buys time, but deeper structural issues, especially the asymmetry in the auto sector, are not easily resolved.
Policy Considerations for the U.S.
To make the most of the 2025 trade deal, the U.S. should pursue several strategies:
-
Invest in Competitiveness: Support domestic manufacturing, especially in autos, batteries, semiconductors, and robotics, to reduce reliance on imports.
-
Enforce Market Access: Hold Japan accountable for commitments to open its markets, especially in autos and agriculture.
-
Monitor Compliance: Ensure rules of origin are enforced to prevent tariff circumvention.
-
Leverage Japanese Investment: Align incoming Japanese capital with U.S. industrial policy goals, such as reshoring semiconductor and EV supply chains.
-
Adapt Flexibly: Maintain review mechanisms to adjust tariffs or commitments if trade patterns shift unexpectedly.
Conclusion and Final Verdict
In conclusion, the U.S.–Japan trade relationship is complex, resilient, and strategically vital. The 2024 figures show a significant goods trade deficit of nearly $69 billion, heavily concentrated in automobiles, machinery, and electronics. The 2025 trade deal introduced reciprocal 15% tariffs, a massive Japanese investment pledge, and promises of expanded U.S. access to Japan’s markets.
Yet the structural drivers of the deficit, industrial specialization, consumer preferences, and exchange rates remain in place. The deal may slow the growth of the imbalance, and over time, Japanese investment could help rebalance supply chains. But unless U.S. industries strengthen their competitiveness and U.S. exports gain real traction in Japan, the bilateral trade deficit is likely to persist. The U.S.–Japan trade relationship is not just about numbers. It is about managing interdependence between two of the world’s largest economies while aligning trade, investment, and strategic priorities.
We hope that you liked our interactive blog report on the US-Japan trade deal, trade deficit, & top US imports from Japan in 2025. For more insights into the latest US trade data, or search live US import-export data by country, product, or HS code, visit USImportdata. Contact us at info@tradeimex.in for customized US trade reports, market insights, and the US importer-exporter database.
Also read about:
What's Your Reaction?