How the US Trade Agreements Affect Exports: USMCA, US-EU, & Indo-Pacific
Discover how US trade agreements like USMCA, US-EU, and Indo-Pacific partnerships shape US exports. Explore trade data, key sectors, and export trends.
The United States, being one of the largest economies in the world, has entered into several significant trade agreements that have had a profound impact on its exports & the overall US export data. By lowering or doing away with tariffs and other trade restrictions, US trade agreements typically seek to increase exports by making it simpler and less expensive for US businesses to export goods and services to their trading partners. Additionally, by creating a more stable and open trading environment, these agreements expand market accessibility and stimulate investment.
The US Free Trade agreements can make it easier for American firms to participate and compete in the global market by opening markets and increasing opportunities for US workers and businesses. By including pledges to lower and remove tariffs as well as several non-tariff trade barriers that impede or skew trade flows, trade agreements help improve the business environment. In this article, we will explore how trade agreements such as the USMCA, US-EU, and Indo-Pacific have influenced the export landscape of the United States.
Some major US Trade Agreements, including free trade agreements & trade promotion agreements over the years are:
-
U.S.–Australia FTA (2005): Eliminated tariffs on over 99% of U.S.-manufactured goods, boosting exports that make up 93% of U.S. sales in Australia.
-
U.S.–Bahrain FTA (2006): Made nearly all industrial and consumer goods trade duty-free immediately, with full liberalization within 10 years.
-
CAFTA–DR (2006–2009): More than 80% of U.S. consumer and industrial exports to Central America and the Dominican Republic became duty-free, solidifying regional trade benefits.
-
USMCA (2020): Replaced NAFTA; modernized trade with Canada and Mexico across autos, agriculture, labor standards, and digital trade.
-
U.S.–Chile FTA (2004): Made 85% of consumer and industrial trade duty-free on day one, with the rest phased out over 12 years.
-
U.S.–Israel FTA (1985): The first U.S. FTA; all tariffs eliminated by 1995, setting the template for future agreements.
-
U.S.–Jordan FTA (2001): Eliminated nearly all tariffs within 10 years, with many products becoming duty-free well before 2011.
-
U.S.–Morocco FTA (2006): Instantly removed tariffs on 95% of U.S. industrial and consumer goods, with long phase-outs for a few sensitive products.
-
U.S.–Oman FTA (2009): All industrial and consumer goods became duty-free immediately, with a 10-year phase-out for the rest.
-
U.S.–Peru TPA (2009): Eliminated tariffs on 80% of U.S. exports right away, with the remaining phased out over a decade.
-
U.S.–Singapore FTA (2004): Eliminated all tariffs on U.S. goods immediately; Singaporean goods received phased U.S. duty elimination within 10 years.
-
U.S.–Colombia TPA (2012): Phased in duty-free access for nearly all goods, significantly enhancing bilateral trade.
-
U.S.–Korea FTA (KORUS, 2012): Opened markets for U.S. autos, agriculture, and services, becoming one of the most commercially significant FTAs in Asia.
-
U.S.–Panama TPA (2012): Eliminated tariffs on over 88% of U.S. exports to Panama immediately, promoting trade in agriculture, services, and investment.
USMCA: Strengthening North American Trade
The United States-Mexico-Canada Agreement (USMCA) replaced the North American Free Trade Agreement (NAFTA) in 2020, aiming to modernize and improve trade relations between the three North American countries. The USMCA has several provisions that have had a direct impact on US exports.
One of the key components of the USMCA is the increase in the percentage of automobile parts that must be produced in North America to qualify for duty-free treatment. This has incentivized more US manufacturers to source their parts locally, boosting domestic production and ultimately increasing US exports of automobiles and automobile parts.
Additionally, the USMCA includes provisions related to intellectual property rights, digital trade, and labor rights, all of which have contributed to creating a more favorable environment for US exporters. By ensuring fair competition and protecting intellectual property, the USMCA has helped US companies expand their export opportunities in the North American market, as per the North America Trade Data.
Overview & Historical Context
-
Replaced NAFTA on July 1, 2020; aimed to modernize trade, boost manufacturing, and strengthen supply chains
-
Focus areas: autos (rules of origin), agriculture (dairy, poultry), digital trade, labor/environment norms.
-
Supported 3+ million American jobs; goods trade more than doubled in the first decade.
Export Growth: FY2020–2024
-
U.S. goods exports:
-
2021: $193.6 billion
-
2022: $225.1 billion
-
2023: $236.5 billion
-
2024: $248.7 billion (projection)
-
Imports:
-
2021: $193.6 billion; 2024: $248.7 billion.
-
Persistent goods trade deficit (approx. –$63 billion in 2024), but narrowing.
Sector Breakdown
-
Automotive: ROO lifted U.S. content, slightly increased export competitiveness; USITC projects +6% export growth to Canada, +6.7% to Mexico.
-
Agriculture: Expanded access, especially U.S. dairy/poultry to Canada, the dairy market share grew from 1% to 3.6% in late 2020.
Jobs & Supply Chains
-
3 million jobs supported across the trio.
-
Nearshoring trends boost export potentials in key sectors like EVs, semiconductors, and textiles. Mexico alone is expected to add $35 billion in extra export value.
Monthly Exports (2021–2024)
|
Year/Month |
Exports $million |
Imports $million |
Balance $million |
|
Jan–Dec 2021 |
193,631 |
193,631 |
0 |
|
Jan–Dec 2022 |
225,147 |
225,147 |
0 |
|
Jan–Dec 2023 |
236,466 |
236,466 |
0 |
|
Jan–Dec 2024 |
248,712 |
248,712 |
0 |
Key Impacts
-
Positive: Rising exports in autos, agriculture, and capital goods.
-
Negative/Neutral: Overall deficit remains; agricultural gains are modest beyond poultry/dairy.
-
Structural: Strengthened supply chains, reshoring trends.
US-EU Trade Agreement: Strengthening Transatlantic Ties
The United States and the European Union are each other's largest trading partners, with a significant volume of goods and services exchanged between the two economic powerhouses. Negotiations for a comprehensive US-EU trade negotiations & agreement have been ongoing for years to reduce trade barriers and increase market access for US exporters.
A potential US-EU trade agreement could have a profound impact on US exports, particularly in sectors such as agriculture, automobiles, and pharmaceuticals. By harmonizing regulations and reducing tariffs, US exporters could see increased demand for their products in the massive European market.
Furthermore, a US-EU trade agreement would not only benefit US exporters but also strengthen transatlantic ties and promote greater economic cooperation between the two regions. With the European Union being a key market for US exports, a successful trade agreement could open up new opportunities for American companies to expand their presence in Europe.
Overview
-
No formal FTA since TTIP failed in 2016.
-
Relaunch through the Trade & Technology Council (2021), recent tariff talks suggest a de facto interim trade framework.
-
Focuses on steel, autos, digital trade, and services.
Trade Volumes & Balances
-
Goods + services: $1.4 trillion in 2024.
-
Goods only (2024): U.S. exports $370–444 billion; imports $606–656 billion; goods deficit - $236 billion.
-
EU side (2024): €503 billion exports to U.S., €347 billion imports; surplus €157 billion.
Trend Evolution (2023–2024)
-
EU monthly exports to the U.S. rose from €39.8 billion to €45.4 billion.
-
Imports from U.S.: declined (Jan 2023 €31.3 billion to Dec 2024 €27.5 billion), widening EU surplus.
U.S. Export & Trade Deficit with EU
|
Metric |
2023 |
2024 |
|
U.S. goods exports |
$370–444 billion |
$370 billion (per trade/w services) |
|
U.S. goods imports |
$606–656 billion |
$606 billion |
|
Goods deficit |
$236 billion |
$236 billion |
|
Total goods & services trade |
$1.4 trillion |
$1.6 trillion |
Top Categories
-
US Imports From EU: Pharma (Ireland), autos, and machinery
-
EU Imports From US: Oil/gas, aircraft, agricultural & digital services
Tariff Dynamics & Effects
-
U.S. tariffs: steel (50%), autos (25%), other goods (10%) under the Trump-era & Trump 2025 threat.
-
EU retaliatory tariffs ($23 billion on U.S. exports: soybeans, motorcycles, etc.
-
There's a tariff pause through July 9, 2025; the EU is seeking zero‑tariff resolution.
Implications for U.S. Exports
-
Short‑term risk: escalating tit‑for‑tat tariffs reduce competitiveness, especially in autos/agriculture.
-
Medium‑term potential: structured negotiation (e.g., tariff rollbacks) could uncork ~$160 billion/year in service sector surplus.
-
Supply chain: digital services, auto parts, and semiconductors remain vulnerable to fragmentation.
US-Indo-Pacific Trade Agreement: Tapping into a Fast-Growing Region
The Indo-Pacific region is home to some of the fastest-growing economies in the world, presenting significant opportunities for US exporters looking to diversify their markets. The United States has been actively pursuing trade agreements with countries in the Indo-Pacific region to unlock new export opportunities and strengthen economic ties with talks on the Indo-Pacific Economic Framework for Prosperity (IPEF).
By entering into trade agreements with countries such as Japan, South Korea, and Australia, the United States aims to reduce trade barriers and facilitate greater market access for American exporters. These agreements can lead to an increase in US exports of goods and services to the Indo-Pacific region, tapping into the region's growing consumer base and demand for high-quality American products.
Additionally, a strong presence in the Indo-Pacific region can help the United States counter China's influence and promote economic stability and growth in the region. By forging closer trade ties with Indo-Pacific countries, the United States can enhance its strategic position and secure its economic interests in a critical part of the world.
Framework vs. FTAs
-
IPEF (2022+): trade pillar targets digital trade, labor, green economy, but not a tariff-cutting FTA.
-
US Bilateral FTAs in the Indo-Pacific region:
-
KORUS (updated 2018, effective 2019)
-
US‑Singapore (since 2004)
-
US‑Australia (2005)
-
US‑Japan limited (2020)
-
U.S.–Taiwan TIFA & ongoing.
Economic Scale & Export Share
-
IPEF partners = 40% of global GDP and 28% of global goods/services trade.
-
U.S.–Indo‑Pacific goods/services trade: $2.18 trillion; supports ~4 million U.S. jobs.
-
U.S. FDI in region: $1.07 trillion in 2023.
Country-Level Export Data (2024)
-
US Exports to South Korea: $65.54 billion.
-
US Exports to Singapore: $46.03 billion.
-
US Exports to Australia: $34.59 billion.
-
US Exports to Japan: $79.74 billion.
Key Trends & Impacts
-
Tariff elimination under these FTAs directly boosts U.S. exports in vehicles, machinery, agriculture, and digital services.
-
Competitive challenge: U.S. not in RCEP/CPTPP face trade diversion: RCEP reduced U.S. Asia exports by $5 billion; missing CPTPP = $131 billion forgone gains.
-
Strategic impact: region crucial for digital trade rules, labor/environment standards, IPEF trade pillar mirrors USMCA model.
-
Job support: Indo-Pacific trade sustains 4 million U.S. jobs.
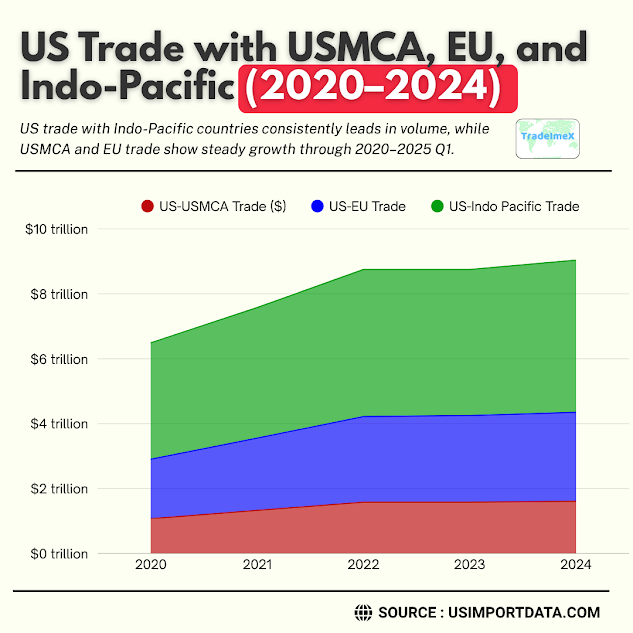
US Trade With USMCA, EU, & Indo Pacific in the Last 5 Years: Major US Trade Agreements
|
Year of Exports |
US-USMCA Trade ($) |
US-EU Trade ($) |
US-Indo Pacific Trade ($) |
|
2020 |
$1.07 trillion |
$766.26 billion |
$1.75 trillion |
|
2021 |
$1.33 trillion |
$893.96 billion |
$1.80 trillion |
|
2022 |
$1.58 trillion |
$1.06 trillion |
$1.89 trillion |
|
2023 |
$1.58 trillion |
$1.09 trillion |
$1.83 trillion |
|
2024 |
$1.61 trillion |
$1.13 trillion |
$1.95 trillion |
|
2025 quarter 1 |
$414.52 billion |
$334.03 billion |
$1 trillion |
Cross‑Agreement Export Trends & Comparison
Export Value & Growth
|
Agreement / Region |
2024 Exports (goods) |
2025 Projection |
Y‑o‑Y change |
|
USMCA |
$236.5 billion |
$248.7 billion |
+5.2% |
|
U.S.–EU |
$370 billion |
$370 billion |
0% |
|
Indo-Pacific FTAs |
$217 billion total |
— |
— |
The sum of Korea, Singapore, Australia, and Japan = $217 billion in exports in 2023.
Trade Balance Impact
-
USMCA: Persistent deficit (–$60 billion), but exports growing faster than imports.
-
U.S.–EU: Major deficit (–$236 billion goods), unchanged exporting pace.
-
Indo‑Pacific: Generally surplus (e.g., Australia); balanced in others.
Sectoral Export Drivers
|
Sectors |
USMCA |
U.S.–EU |
Indo‑Pacific |
|
Automotive |
Auto content & rules |
Tariff threats limit competitiveness |
KORUS boosts; Japan deal limited |
|
Agriculture |
Dairy/poultry gains |
Beer, wine, and soy are under tariff risk |
Key in Australia, Singapore |
|
Machinery & capital goods |
Strong in autos |
U.S. exports of machinery steady |
Japan, Korea, and Australia's growth |
|
Digital & services |
Covered under USMCA |
Major services surplus (~$277 billion) |
Singapore, Japan's digital trade opens under the USJTA |
|
Energy |
Oil/gas exports cross‑border |
U.S. exports of LNG to the EU are increasing |
LNG pathways with Japan, Australia |
Strategic Analysis & Market Outlook
1. Upside Catalysts
-
USMCA: Continued nearshoring & rising U.S. auto/industrial exports to +5–6% growth.
-
EU Framework: Opportunity to reduce tariffs; digital/services trade via TTC; avoid trade wars.
-
Indo-Pacific: Leveraging IPEF’s digital/ labor/environment rules; future CPTPP accession could unlock +$131 billion.
2. Risks & Headwinds
-
Tariff Escalation: U.S.–EU tensions (e.g., 50% steel, 25% autos) threaten $ billions in ag/machinery.
-
Trade Diversion: Asia moving toward RCEP; U.S. lacking CPTPP involvement loses market share.
-
Political Volatility: U.S. policy shifts may dismantle trade frameworks; EU tensions persist.
3. Policy Recommendations
-
USMCA: Accelerate regional value chain investment (EVs, semiconductors).
-
EU engagement: Finalize tariff rollback by July 2025; deepen services agreement.
-
Asia Pacific: Press to formally join CPTPP; strengthen IPEF trade mechanisms; pursue new FTAs (Taiwan, ASEAN).
-
Digital trade momentum: Expand USMCA-style digital chapters to more partners.
Summary of US Trade Agreements – Key Metrics & Exports
|
Agreement / Region |
2023 US Exports ($) |
2024 US Exports ($) |
Trade Balance |
Exports CAGR |
USD Jobs Supported |
|
USMCA (including Canada) |
$236.5 billion |
$248.7 billion |
–60 billion goods |
5%/yr |
3+ million |
|
U.S.–EU (framework) |
$370 billion |
$370 billion |
–236 billion goods |
Flat |
2.3 m goods + surplus services |
|
Indo‑Pacific FTAs (KORUS, etc.) |
$217 billion |
$1.2 trillion |
Balanced/surplus |
+2% |
4 million total |
Insights & Interpretation
-
USMCA shows clear export momentum and regional integration, resilient deficits, but narrowing.
-
U.S.–EU remains massive in scale, but imbalance and tariff risk suggest urgent negotiation.
-
The Indo‑Pacific region offers diversified export growth, digital trade, and stability, yet is constrained by the U.S.'s lack of integration into Asia-Pacific FTAs like CPTPP.
Near‑Term Outlook 2025-26 (Next 12 Months)
-
USMCA exports are expected to keep growing by 5–6% (auto/agricultural tailwinds).
-
U.S.–EU trade vulnerable to tariff escalation; resolution via the TTC could stabilize future trade pipelines.
-
Indo-Pacific FTAs to gradually amplify gains if the U.S. engages in CPTPP/IPEF is carbon and digitally aligned.
Final Take
-
USMCA is pragmatic and delivering export gains, but deficits remain.
-
The EU relationship is colossal, but currently imbalanced and politically charged.
-
The Indo-Pacific region is the future hotspot; the U.S. must engage deeply or risk ceding ground.
US Trade Agreements in 2025 Amid Global Trade War
In 2025, as the global trade war rages on, US trade agreements play a crucial role in shaping the landscape of international commerce. With heightened tensions and shifting alliances, the United States navigates intricate negotiations to establish the US trade deals that not only protect its economic interests but also foster stability amid uncertainties. The US established several bilateral trade agreements & frameworks in 2025, such as the US-UK trade deal, US-Canada trade deal, US-China Trade Framework, and more.
U.S.–UK Economic Prosperity Deal (2025)
Agreement Overview & Application Timeline
-
The US-UK trade deal was signed at the G7 Summit on June 16, 2025, but the terms began implementation immediately.
-
Known as the "Economic Prosperity Deal," it acts like a mini-FTA, focusing on agriculture, autos, aerospace, steel, and aluminum.
-
Includes tariff-rate quotas and preferential treatment:
-
Up to 100,000 UK-made autos/year enter the U.S. at 10% total tariff (MFN + quota).
-
Duty-free access to UK aerospace products.
-
UK steel/aluminum supply-chain commitments; future quota mechanisms.
Trade Impact & Data (2024–2025)
-
Total U.S.–UK goods trade (2024): $148 billion.
-
Boosts for U.S. agricultural exports:
-
Ethanol: +$700 m; Beef & other Agricultural goods: +$250 m annual gain.
-
Projected incremental opportunity: $5 billion in new U.S. exports annually.
Sector Effects
-
Agriculture: Greater access for beef, ethanol, grains; removal of non-tariff barriers.
-
Manufacturing: Autos benefit from tariff-rate quota; aerospace sees tariff elimination.
-
Steel & aluminum: New supply-chain framework; quotas to follow, which will impact the US exports to UK.
Jobs & Growth
-
Supports U.S. farmers, meat processors, automotive, and aerospace manufacturers.
-
Likely to sustain tens of thousands of new U.S. jobs (especially in ethanol and beef sectors).
U.S.–China Trade Framework (May 2025)
Framework Overview
-
Announced May 12, effective May 14, 2025
-
Key terms:
-
Tariff cuts: China's average tariffs are set at 10%, the U.S. baseline is at 30–55%, depending on category, which can impact the US exports to China.
-
Includes 90-day tariff pause with penalties escalating if unresolved by Aug 14.
-
Rare earth minerals: Chinese supply commitments to U.S. manufacturers.
-
A framework, not a full FTA, as it stabilizes trade, prevents further escalation.
Trade Data (H1 2025 estimates)
-
Tariff change reshapes costs, not volume.
-
Data still emerging: likely modest rebound in U.S. exports to China, especially electronics and semiconductors.
Sector Effects
-
Manufacturing & high‑tech: greater access to rare earths; possible easing of electronics tariffs.
-
Agriculture: still affected by earlier Section 301/232 duties.
Next Steps
-
Deadline: Aug 14, 2025—U.S. tariff rates may rise if no resolution.
-
Follow-up negotiations planned.
U.S.–India Early Bilateral Trade Agreement (2025)
Context & Goals
-
Reached early-phase deal ahead of July 9, 2025, reciprocal‑tariff deadline.
-
A "Phase‑One" or Early Tranche BTA targeting tariffs, non-tariff barriers, and digital trade.
-
India seeks assurances against further U.S. duties and reciprocity in future phases.
Preliminary Impact (H1 2025)
-
No precise export figures yet; H1 shipments rose due to pre-tariff adjustment:
-
India’s total exports rose +35% YoY to the U.S. in May 2025.
-
The Thai example shows 18.4% export gains overall, 35% to the US.
-
U.S.–India trade continues discussions targeting Mission 500: boost bilateral trade to $500 billion by 2030.
Sector Effects
-
Textiles, leather are prioritized by India—likely scope for tariff reductions.
-
Digital trade and non‑tariff standards under negotiations.
Strategic Outlook
-
One of the first new U.S. trade deals in 2025, after the UK and China.
-
Sets the stage for a later full FTA.
US Trade Agreements 2025 Summary
|
Agreement |
Signed |
Coverage |
2025 Estimated Impact |
|
U.S.–UK Prosperity Deal |
Jun 16, 2025 |
Autos (100k quota at 10%), aerospace, agriculture, steel/aluminum |
+$5 billion exports; +$700 m ethanol, +$250 m beef; boosts UK‑U.S. trade |
|
U.S.–China Framework |
May 12, 2025 |
Tariff normalization, rare earths |
Stabilized, trade truce; potential improved access for tech/agri |
|
U.S.–India Early BTA |
Target Jul 9, 2025 |
Reciprocal tariffs, digital trade, and non‑tariff barriers |
H1 exports climbing (pre-deal); +35% YoY in May |
US Bilateral Trade Strategic Comparative Summary – 2025 Additions
|
Deal |
Tariff Change |
Trade Volume |
Sector Highlights |
Geopolitical Angle |
|
US–UK |
New quotas, cuts |
+$5 billion exports |
Ethanol, beef, autos, aerospace |
Strengthening UK‑U.S. alliance; job creation for rural/ag regions |
|
US–China |
Partial reductions |
Stabilization, early uptick |
Tech, rare earths, & agriculture |
Defusing major bilateral friction, raw materials security |
|
US–India |
Reciprocal changes possible |
Pre-deal growth; future uplift expected |
Textiles, leather, and digital trade |
Strategic pivot to Asia, long-term Mission 500 potential |
In Summary
-
New deals in 2025 with the UK, China, and India mark a pivotal shift in U.S. trade policy.
-
These deals collectively add several billion in additional U.S. exports and solidify major geopolitical partnerships.
-
The coming 6–12 months will determine whether these early gains translate into sustainable long-term growth.
Conclusion and Final Verdict
In conclusion, the US trade agreements, such as the USMCA, US-EU, and Indo-Pacific, play a vital role in shaping the export landscape of the United States. By reducing trade barriers, harmonizing regulations, and increasing market access, these agreements help American exporters reach new customers and expand their global footprint. As the United States continues to pursue trade agreements with key partners around the world, the impact on US exports is likely to remain a central focus of its economic strategy.
We hope that you liked our insightful blog report on US Trade Agreements & their impact on US exports. Visit USImportdata to access the US trade trends along with the latest US import-export data. Contact us at info@tradeimex.in and get a customized database report on US trade data, with a verified list of the top US export companies.
What's Your Reaction?