US–Malaysia–Cambodia Trade Deal: Insights & Its Impact on Southeast Asia Trade
Explore US imports from Malaysia and Cambodia, plus insights on the US–Malaysia trade agreement and US–Cambodia trade agreement with key Southeast Asia market trends.
Introduction: Why This Trade Deal Matters
Trade agreements involving the United States and Southeast Asian economies often have a broader impact, affecting not only the signatory countries but also their regional neighbors. Because ASEAN supply chains are deeply interconnected, even limited or sector-specific trade deals can reshape production, investment flows, and regional competitiveness.
According to the US import data, the total value of US imports from Malaysia reached $53.85 billion in 2024, making Malaysia one of the U.S.’s largest sources of imports in Southeast Asia. In the same year, total US exports to Malaysia were about $27.71 billion, reflecting strong demand for American machinery, electronic equipment, aircraft, and other industrial products, as per the US export data. Discussions around Southeast Asian trade often highlight the Malaysia trade deficit with US, which has renewed interest in whether a formal US Malaysia trade agreement or a broader Malaysia trade agreement with US could help rebalance trade flows, boost market access, and strengthen supply chains.
The emerging US–Malaysia–Cambodia trade framework, while not a single comprehensive free trade agreement, represents a coordinated set of bilateral and trilateral trade, investment, and supply chain initiatives. Together, they signal a strategic shift in how the US engages with mid-sized and frontier economies in Southeast Asia. This report breaks down the details of the deal, the data behind current trade relationships, and how the agreement is likely to impact Southeast Asia’s trade landscape over the next five to ten years.
Background: Existing Trade Relationships at a Glance
US–Malaysia Trade Snapshot
Malaysia is already one of the US’s most important trading partners in Southeast Asia, as per the global trade data.
Key figures:
-
Total US–Malaysia goods trade exceeds USD 70 billion annually.
-
Malaysia consistently ranks among the top 25 US trading partners worldwide.
-
The US is one of Malaysia’s largest export destinations, particularly for:
-
Electrical and electronic (E&E) products
-
Semiconductors
-
Medical devices
-
Machinery and equipment
Malaysia’s trade surplus with the US has widened over the past decade, driven largely by its role in global electronics supply chains, as per the data on Malaysia-US trade.
US–Cambodia Trade Snapshot
Cambodia’s trade relationship with the US is smaller in absolute terms but significant relative to Cambodia’s economy.
Key figures:
-
Annual bilateral trade exceeds USD 10 billion.
-
Over 95 percent of Cambodia’s exports to the US are garments, footwear, and travel goods.
-
The US is Cambodia’s largest single export market.
Cambodia’s economy is far more dependent on US market access than Malaysia’s, making trade concessions and labor standards a central issue in negotiations.
Malaysia–Cambodia Trade Context
Malaysia and Cambodia are both ASEAN members, meaning:
-
Tariffs between them are already low under ASEAN Free Trade Area rules.
-
Investment, rather than tariffs, is the main channel of impact.
Malaysia is a notable source of foreign direct investment in Cambodia, particularly in:
-
Manufacturing
-
Real estate
-
Banking and financial services
What Is the US–Malaysia–Cambodia Trade Deal?
Rather than a single treaty, the “deal” refers to a coordinated set of agreements and policy commitments finalized or announced under broader US Indo-Pacific trade initiatives.
Core Components
-
Supply Chain Resilience Agreements
-
Focus on semiconductors, electronics, and critical manufacturing inputs.
-
Malaysia is positioned as a higher-end manufacturing and testing hub.
-
Cambodia is positioned as a complementary labor-intensive production base.
-
Labor and Environmental Standards
-
Cambodia commits to enhanced labor monitoring in export sectors.
-
Malaysia strengthens environmental reporting and compliance for US-bound exports.
-
Trade Facilitation Measures
-
Faster customs clearance.
-
Digital trade documentation.
-
Simplified rules of origin for integrated supply chains.
-
Investment and Capacity Building
-
US-backed financing for infrastructure and logistics.
-
Technical assistance for Cambodian manufacturers.
-
Support for Malaysian SMEs integrating into US supply chains.
This structure reflects the US preference for flexible, modular trade frameworks rather than traditional free trade agreements.
Strategic Drivers Behind the Deal
1. Supply Chain Diversification Away From China
One of the clearest drivers is the US strategy to reduce overreliance on China-centric supply chains.
-
Malaysia already accounts for roughly 13 percent of global semiconductor testing and packaging.
-
Cambodia offers cost-competitive labor for downstream assembly and manufacturing.
By linking the two economies more tightly with US firms, the deal supports a “China-plus-one” or “China-plus-many” strategy.
2. ASEAN Centrality and Geopolitical Balance
The US is careful to frame the deal as supportive of ASEAN rather than competitive with it.
-
Malaysia acts as a regional anchor economy.
-
Cambodia, often perceived as closely aligned with China, gains an alternative trade and investment channel.
This reduces the risk of Southeast Asia becoming economically polarized.
3. Domestic Economic Goals in Southeast Asia
For Malaysia:
-
Move up the value chain.
-
Reduce dependence on low-margin assembly.
-
Attract higher-quality foreign investment.
For Cambodia:
-
Diversify beyond garments.
-
Improve labor standards to retain market access.
-
Build industrial capacity without over-dependence on a single partner.
Multilateral Trade Data: Key Figures and Trends
To understand the real weight of the US–Malaysia–Cambodia trade framework, it helps to look closely at bilateral trade values and how they sit within wider ASEAN and global trade patterns. The numbers highlight why this arrangement matters beyond the three countries involved.
1. United States – ASEAN Trade Overview
The US is one of ASEAN’s largest external trade partners.
-
Total US–ASEAN goods trade exceeded USD 480 billion in recent years.
-
ASEAN collectively ranks as the fourth-largest US trading partner, after Canada, Mexico, and China.
-
US imports from ASEAN are significantly higher than exports, reflecting ASEAN’s role as a manufacturing base.
Top ASEAN exporters to the US include:
-
Vietnam
-
Malaysia
-
Thailand
-
Indonesia
-
Cambodia (smaller in value, but high in dependency)
This broader context shows that bilateral deals with individual ASEAN members can have spillover effects across the region.
2. US–Malaysia Bilateral Trade Data
Malaysia is among the most trade-integrated Southeast Asian economies with the US.
Trade values:
-
Total goods trade: USD 70–75 billion annually
-
US imports from Malaysia: USD 50+ billion
-
US exports to Malaysia: USD 20+ billion
Key Malaysian exports to the US:
-
Electrical and electronic products (over 60 percent of exports)
-
Semiconductors and integrated circuits
-
Medical devices
-
Optical and scientific equipment
Key US exports to Malaysia:
-
Semiconductors and electronic components
-
Machinery
-
Aircraft and parts
-
Chemicals
Malaysia consistently runs a trade surplus of over USD 25 billion with the US, driven by its strong position in high-value electronics manufacturing.
3. US–Cambodia Bilateral Trade Data
Cambodia’s trade relationship with the US is smaller in absolute terms but critical to its economy.
Trade values:
-
Total goods trade: USD 10–12 billion annually
-
Cambodian exports to the US: USD 9+ billion
-
US exports to Cambodia: Less than USD 1 billion
Export concentration:
-
Garments, footwear, and travel goods account for over 95 percent of exports.
-
The US absorbs roughly 40 percent of Cambodia’s total exports, making it Cambodia’s single most important market.
Cambodia’s trade surplus with the US regularly exceeds USD 8 billion, reflecting limited diversification and low US export penetration.
4. Foreign Direct Investment (FDI) Flows
Trade data alone does not capture the full picture. Investment flows are equally important.
US investment in Malaysia:
-
Cumulative US FDI stock exceeds USD 30 billion.
-
Concentrated in electronics, energy, and manufacturing services.
Malaysia’s investment role in Cambodia:
-
Malaysia ranks among Cambodia’s top 10 foreign investors.
-
Major sectors include manufacturing, banking, property development, and energy.
US investment in Cambodia:
-
Smaller in scale, but increasing.
-
Focused on garments sourcing, trade, and light manufacturing.
The trade framework aims to strengthen the FDI–trade linkage, especially by routing US investment through Malaysia into Cambodian production networks.
5. ASEAN Supply Chain Positioning: Comparative Figures
A comparison with regional competitors highlights why Malaysia and Cambodia were chosen.
-
Malaysia accounts for roughly 13 percent of global semiconductor testing and packaging.
-
Vietnam exports over USD 120 billion in goods to the US annually, creating competitive pressure.
-
Cambodia’s average manufacturing wages remain 30–40 percent lower than those in Vietnam and Thailand.
This cost–capability balance allows Malaysia and Cambodia to operate at different but complementary points in the same supply chain.
6. Projected Trade Impact (Medium-Term Estimates)
Based on current trade elasticity and announced policy commitments:
-
US–Malaysia trade could expand by USD 15–20 billion over five years.
-
US–Cambodia trade could grow by USD 3–5 billion, assuming diversification beyond garments.
-
Intra-ASEAN intermediate goods trade linked to US-bound exports could rise by 8–10 percent.
These gains would not be evenly distributed but would favor firms able to meet compliance and traceability requirements.
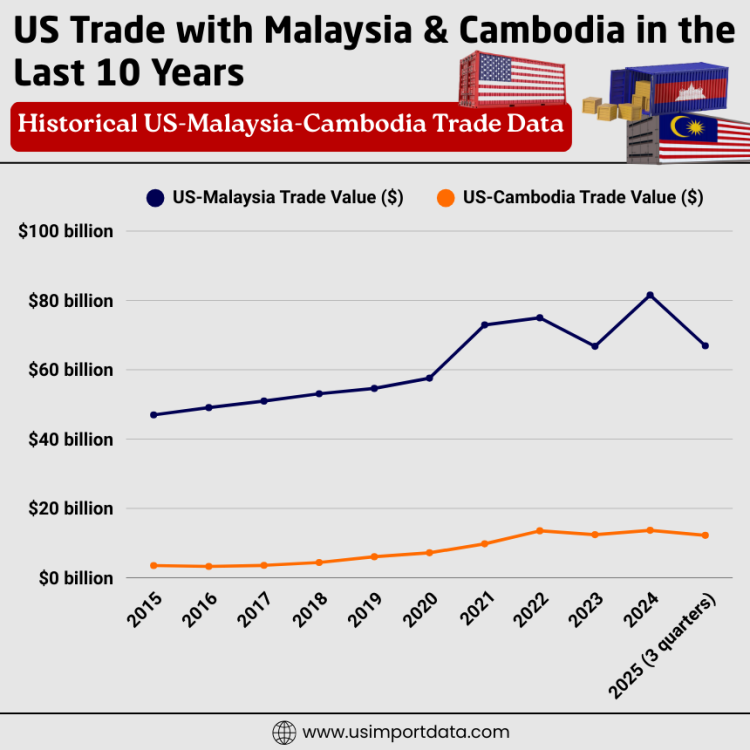
US Trade with Malaysia & Cambodia in the Last 10 Years: Historical US-Malaysia-Cambodia Trade Data
|
Year of Trade |
US-Malaysia Trade Value ($) |
US-Cambodia Trade Value ($) |
|
2015 |
$46.99 billion |
$3.53 billion |
|
2016 |
$49.07 billion |
$3.27 billion |
|
2017 |
$50.96 billion |
$3.57 billion |
|
2018 |
$53.07 billion |
$4.40 billion |
|
2019 |
$54.61 billion |
$6.06 billion |
|
2020 |
$57.58 billion |
$7.20 billion |
|
2021 |
$72.92 billion |
$9.78 billion |
|
2022 |
$74.99 billion |
$13.54 billion |
|
2023 |
$66.76 billion |
$12.43 billion |
|
2024 |
$81.54 billion |
$13.68 billion |
|
2025 (3 quarters) |
$66.91 billion |
$12.24 billion |
Top Traded Goods Between the US and Malaysia
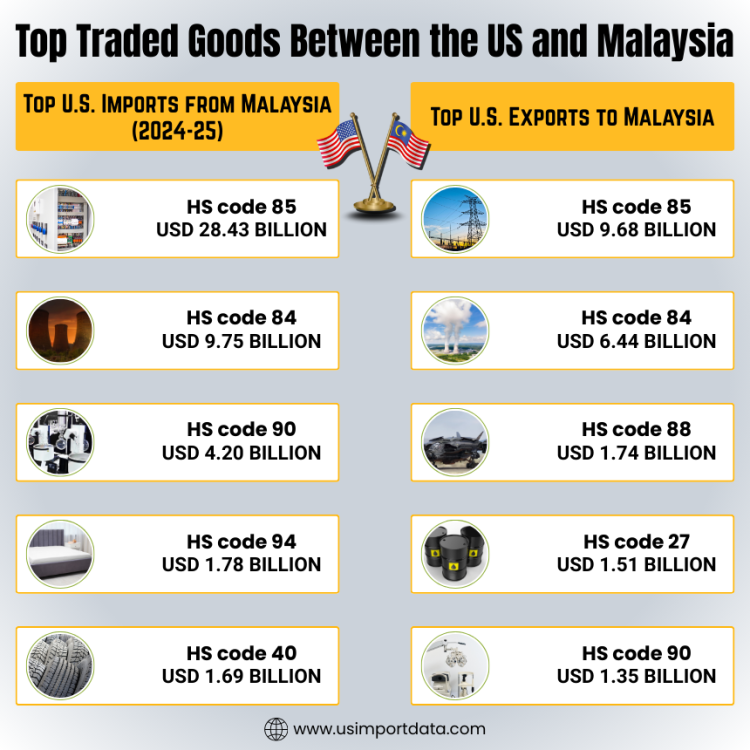
Top U.S. Imports from Malaysia (2024-25)
In 2024, total U.S. imports from Malaysia reached approximately USD 53.85 billion. Electronics are the largest goods that the US imports from Malaysia, as per the data on US electronics imports from Malaysia by HS code. The top goods imported included the following categories:
-
Electrical Machinery & Equipment (HS code 85): USD 28.43 billion
-
Nuclear Reactors & Machinery (HS code 84): USD 9.75 billion
-
Optical & Medical Apparatus (HS code 90): USD 4.20 billion
-
Furniture, Bedding, & Mattresses (HS code 94): USD 1.78 billion
-
Rubber & Rubber Articles (HS code 40): USD 1.69 billion
Top U.S. Exports to Malaysia (2024-25)
Total U.S. goods exports to Malaysia were about USD 27.6 billion in 2024. Key categories included:
-
Electrical Machinery & Equipment (HS code 85): USD 9.68 billion
-
Nuclear Reactors & Machinery (HS code 84): USD 6.44 billion
-
Aircraft & Spacecraft (HS code 88): USD 1.74 billion
-
Mineral Fuels & Oils (HS code 27): USD 1.51 billion
-
Optical & Medical Apparatus (HS code 90): USD 1.35 billion
Top Traded Goods Between the US and Cambodia
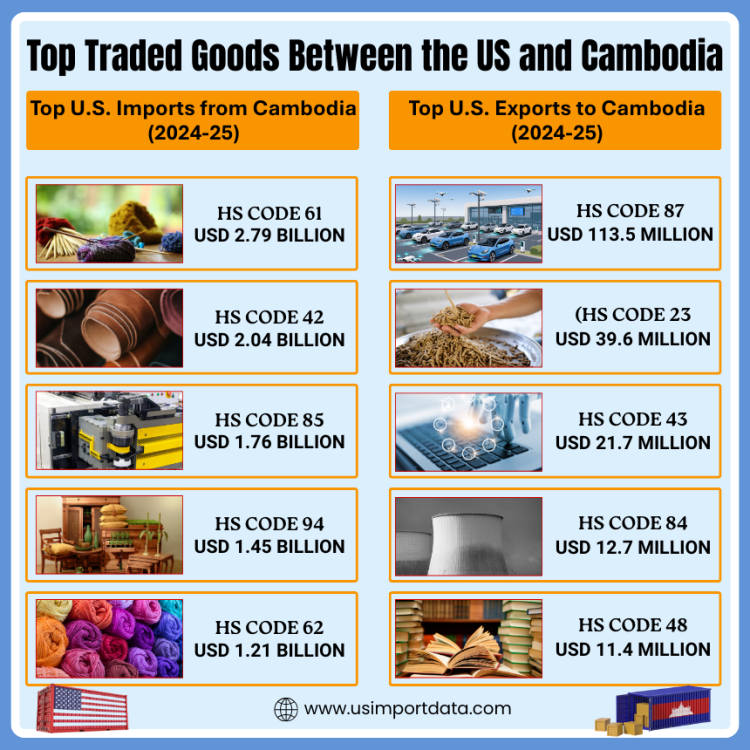
Top U.S. Imports from Cambodia (2024-25)
US imports from Cambodia totaled approximately USD 13.36 billion in 2024. The leading categories were:
-
Articles of Apparel, Knit or Crocheted (HS code 61): USD 2.79 billion
-
Articles of Leather & Travel Goods (HS code 42): USD 2.04 billion
-
Electrical Machinery & Equipment (HS code 85): USD 1.76 billion
-
Furniture, Bedding, & Mattresses (HS code 94): USD 1.45 billion
-
Articles of Apparel, Not Knit or Crocheted (HS code 62): USD 1.21 billion
Top U.S. Exports to Cambodia (2024-25)
US exports to Cambodia were comparatively modest, totaling around USD 321.6 million in 2024. Vehicles top the list as the biggest US exports to Cambodia, as per the data on US vehicle exports to Cambodia by HS code. Major export categories included:
-
Vehicles (HS code 87): USD 113.5 million
-
Prepared Animal Fodder (HS code 23): USD 39.6 million
-
Furskins & Artificial Fur Manufacturers (HS code 43): USD 21.7 million
-
Nuclear Reactors & Machinery (HS code 84): USD 12.7 million
-
Paper & Paperboard Articles (HS code 48): USD 11.4 million
Why These Numbers Matter
The data shows that this trade framework is not symbolic. It builds on existing trade volumes that are already large, especially between the US and Malaysia, while reshaping Cambodia’s export dependence through tighter standards and diversification incentives. More importantly, it reinforces Southeast Asia’s role as a connected production ecosystem, where bilateral deals quietly influence multilateral trade outcomes across ASEAN.
Sector-Level Impact Analysis
Electronics and Semiconductors
This is the most important sector in the deal.
Malaysia:
-
Already hosts major US firms in semiconductor testing and advanced manufacturing.
-
Gains preferential access to the US supply chain initiatives.
-
Benefits from US-backed R&D collaboration.
Cambodia:
-
Likely to receive spillover investments in:
-
Basic electronics assembly
-
Component manufacturing
-
Still several years away from advanced semiconductor roles.
Regional impact:
-
Strengthens Southeast Asia’s position as the world’s second-largest electronics manufacturing region after East Asia.
-
Reduces concentration risk in a single country.
Apparel and Footwear
Cambodia’s garment sector remains central.
Key changes:
-
Stricter labor compliance tied to trade preferences.
-
Incentives for US brands to retain sourcing from Cambodia rather than shifting to South Asia or Africa.
Data context:
-
Garments employ over 700,000 workers in Cambodia.
-
The sector accounts for more than 40 percent of export earnings.
If compliance costs rise modestly but predictably, most large buyers are expected to stay.
Automotive and Machinery
Malaysia stands to gain more here.
-
US firms are exploring Southeast Asia as an alternative production base for auto parts and industrial machinery.
-
Malaysia’s skilled workforce and infrastructure make it a natural hub.
Cambodia may benefit indirectly through:
-
Wire harnesses
-
Simple components
-
Trade services
Trade Data: Expected Shifts Over Five Years
Based on historical trends and announced investments, several projections are realistic.
US–Malaysia Trade
-
Annual trade growth of 4–6 percent.
-
Electronics and medical devices are outpacing overall trade growth.
-
Higher US imports of value-added products rather than basic components.
US–Cambodia Trade
-
Short-term volatility as labor reforms are implemented.
-
Medium-term growth of 6–8 percent annually.
-
Gradual diversification beyond garments to light manufacturing.
Intra-ASEAN Trade Effects
-
Malaysia–Cambodia trade volumes likely to increase through:
-
Intermediate goods flows.
-
Cross-border investment.
-
Other ASEAN members may integrate indirectly as suppliers.
Impact on Southeast Asia’s Trade Architecture
1. Shift Toward Modular Trade Agreements
This deal reinforces a broader trend:
-
Smaller, flexible agreements.
-
Sector-specific commitments.
-
Faster implementation than traditional FTAs.
Other ASEAN countries may pursue similar arrangements with the US.
2. Pressure on Regional Competitors
Countries likely to feel competitive pressure include:
-
Vietnam, particularly in garments and electronics.
-
Thailand, in automotive supply chains.
-
Indonesia, if regulatory reforms lag.
This could accelerate reforms across the region.
3. Stronger Compliance Expectations
Labor, environmental, and governance standards are no longer optional.
For Southeast Asia:
-
Compliance becomes a competitive advantage.
-
Countries that adapt faster attract higher-quality investment.
Risks and Challenges
Political and Regulatory Risk
-
Cambodia’s labor reforms require sustained political commitment.
-
Malaysia must balance environmental standards with industrial growth.
Any rollback could trigger trade disputes or investor hesitation.
US Domestic Politics
-
Trade policy shifts after elections could slow implementation.
-
However, supply chain resilience enjoys bipartisan support, reducing the risk of reversal.
Long-Term Implications for ASEAN
Over the next decade, this deal could contribute to:
-
A more diversified regional manufacturing base.
-
Reduced vulnerability to single-country shocks.
-
Stronger bargaining power for ASEAN in global trade negotiations.
It also reinforces the idea that Southeast Asia is no longer just a low-cost manufacturing zone but a strategic partner in global supply chains.
Conclusion: A Quiet but Significant Shift
In conclusion, the US–Malaysia–Cambodia trade deal is not dramatic in form, but it is significant in substance. It reflects a new model of trade engagement that prioritizes resilience, standards, and strategic alignment over sweeping tariff cuts. For Malaysia, it supports the move toward higher-value manufacturing and deeper integration with US technology supply chains. For Cambodia, it offers a path to diversify its economy while maintaining critical access to its largest export market in global trade.
For Southeast Asia as a whole, the deal reinforces the region’s role as a central node in global trade at a time when supply chains are being rethought and restructured. The real impact will not be measured in headlines, but in factories built, workers trained, and trade flows quietly redirected over the next five to ten years.
We hope you liked our insightful & interactive blog report on the US-Malaysia-Cambodia trade deal. For more information on the latest US trade data, or to search live US import-export data by country, visit USImportdata. Contact us at info@tradeimex.in for customized trade reports and market insights.
What's Your Reaction?