Exploring US Rice Exports by Country in 2024-25: Export Data on Rice Exports from USA
Explore the latest data on US rice exports by country in 2024-25. Get insights into top destinations, US rice production, & top US rice exporters.
In recent years, the United States has emerged as one of the world's leading exporters of rice. With its rich agricultural resources and advanced farming techniques, the US can produce large quantities of high-quality rice for export to countries around the globe. According to the US export data and Rice export data of the USA, the total value of US rice exports reached $2.43 billion in 2024, a 21% increase from the previous year. The US exported rice at a total quantity of 3.82 million metric tons. According to the US rice export statistics, US rice exports totaled $573.13 million in the first quarter of 2025. The US is the 5th largest rice exporter in the world with a 6.2% global rice export share, as per the global trade data.
Exploring U.S. Rice Exports in 2024–25: Key Data & Trends
Quick Snapshot
-
2024 Export Volume: 3.82 million metric tons
-
Export Value: $2.43 billion
-
Top Buyers: Mexico, Japan, Haiti, South Korea
-
Biggest Drop: Long-grain exports to Latin America
-
Main Threat: Cheaper rice from Brazil and other countries
US Rice Exports by Country: Where Does the US Export Rice?
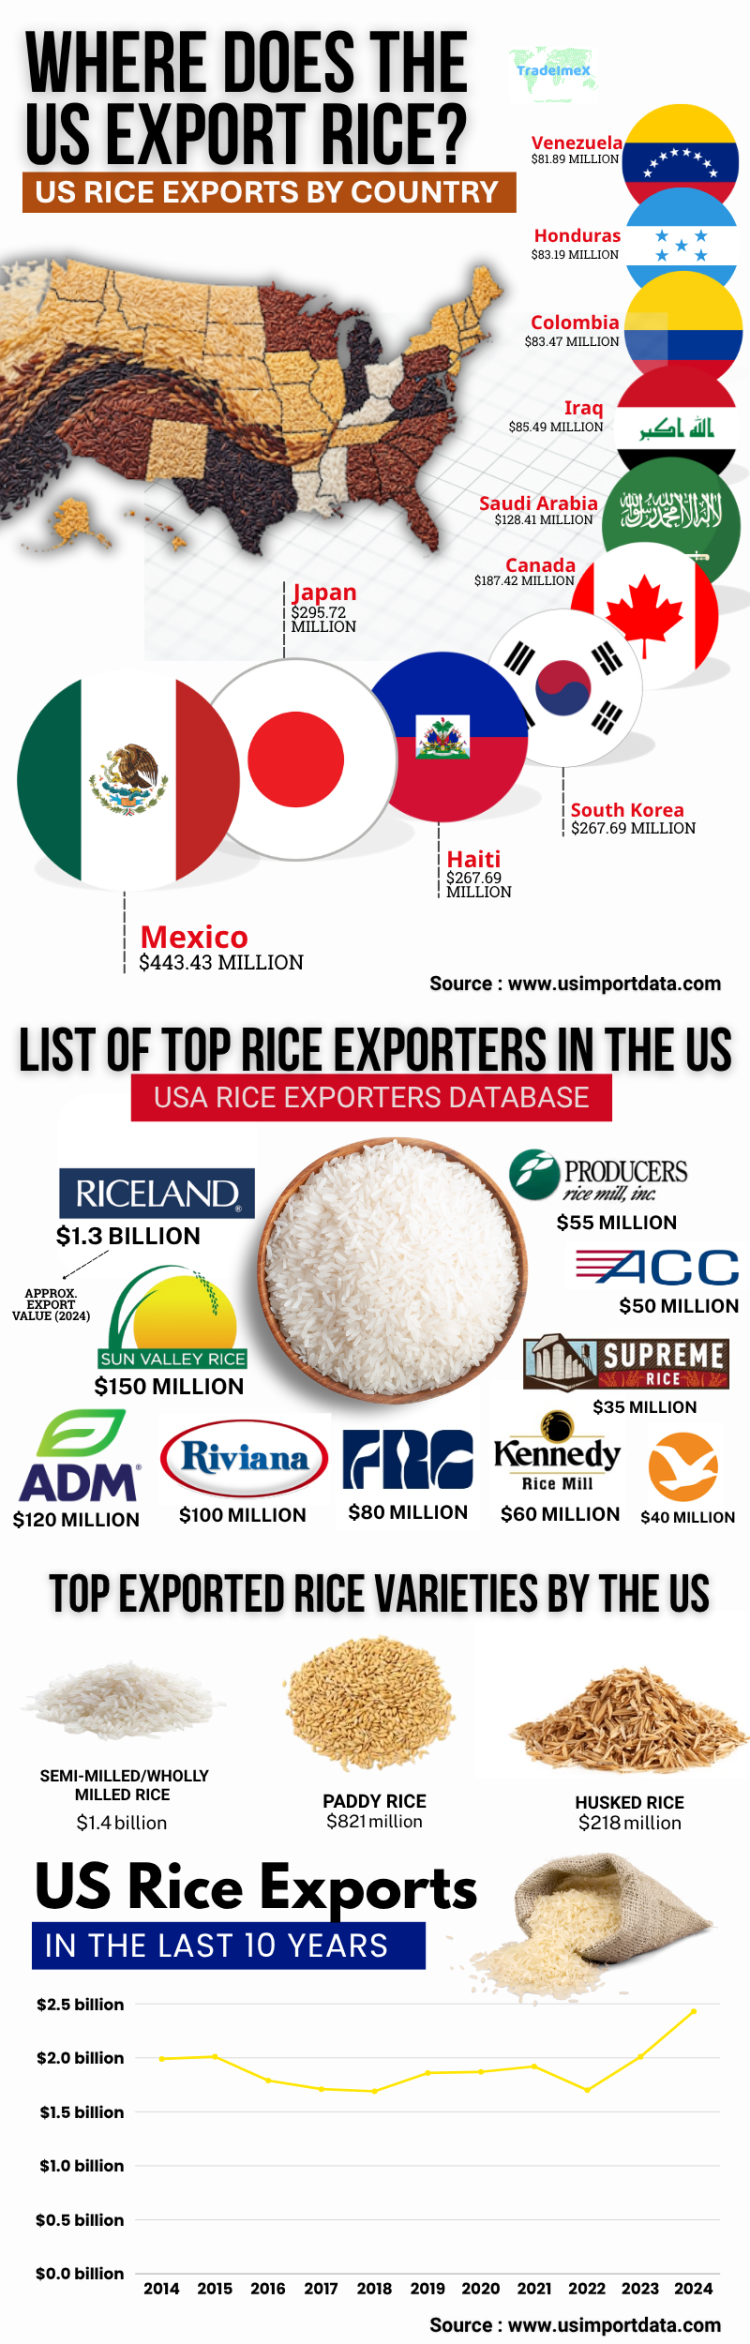
Rice is a staple food for many cultures worldwide, and the United States is one of the leading producers of this essential grain, according to the global rice export data. US rice exports by country showcase the diverse global market reach of the United States. Major export destinations for US rice include top buyers such as Mexico, Japan, and Canada. Notably, these countries have consistently shown a robust demand for American rice due to its quality, variety, and reliability. The top 10 export destinations for US rice exports by country, as per the US rice export data and US shipment data for 2024-25, include:
1. Mexico: $443.43 million (15.6%)
Mexico emerges as the top destination for US rice exports, with a value of $443.43 million, accounting for 15.6% of total US rice exports. The proximity of Mexico to the US makes it a natural trading partner, with a high demand for rice products in the Mexican market.
2. Japan: $295.72 million (14.2%)
Japan is the second-largest importer of US rice, with a value of $295.72 million, making up 14.2% of total US rice exports, as per the data on US rice exports to Japan. The Japanese market places a premium on quality rice varieties, making US rice a popular choice for consumers in Japan.
3. Haiti: $267.69 million (10.5%)
Haiti ranks third on the list of top US rice export destinations, with a value of $267.69 million, representing 10.5% of total US rice exports. The demand for rice in Haiti continues to grow, creating opportunities for US rice producers to expand their market share in the country.
4. South Korea: $198.78 million (8.8%)
South Korea is a significant market for US rice exports, with a value of $198.78 million, accounting for 8.8% of total US rice exports, as per the data on US rice exports to South Korea by HS code. The South Korean market values high-quality rice products, offering US rice producers a competitive edge in this market.
5. Canada: $187.42 million (8.4%)
Canada ranks fifth on the list of top US rice export destinations, with a value of $187.42 million, making up 8.4% of total US rice exports. The proximity of Canada to the US makes it a convenient trading partner for US rice producers, facilitating the smooth flow of rice exports between the two countries.
6. Saudi Arabia: $128.41 million (6.1%)
Saudi Arabia emerges as a key market for US rice exports, with a value of $128.41 million, representing 6.1% of total US rice exports. The demand for rice in Saudi Arabia is influenced by cultural preferences and dietary habits, creating opportunities for US rice producers to cater to this market.
7. Iraq: $85.49 million (5.6%)
Iraq is a significant importer of US rice, with a value of $85.49 million, accounting for 5.6% of total US rice exports. The demand for rice in Iraq remains strong, driven by population growth and changing consumption patterns, presenting lucrative opportunities for US rice producers.
8. Colombia: $83.47 million (4.2%)
Colombia ranks eighth on the list of top US rice export destinations, with a value of $83.47 million, making up 4.2% of total US rice exports. The Colombian market offers a growing consumer base for US rice products, with increasing demand for premium rice varieties.
9. Honduras: $83.19 million (3.9%)
Honduras is a significant market for US rice exports, with a value of $83.19 million, representing 3.9% of total US rice exports. The demand for rice in Honduras is driven by various factors, including population growth, urbanization, and changing dietary preferences, creating opportunities for US rice producers to meet the needs of the Honduran market.
10. Venezuela: $81.89 million (2.6%)
Venezuela rounds up the list of the top 10 US rice export destinations, with a value of $81.89 million, accounting for 2.6% of total US rice exports. The Venezuelan market offers potential opportunities for US rice producers to expand their presence in this evolving rice export market.
List of Top Rice Exporters in the US: USA Rice Exporters Database
The USA Rice Exporters Database provides a comprehensive list of the top rice exporters in the US, offering valuable insights into the industry's key players. This database serves as a valuable resource for those seeking to engage in international trade and collaborate with prominent rice-exporting companies. Companies like Riceland Foods and Sun Valley Rice lead the rice export market in the US as the top exporters of Rice. The top 10 leading rice exporting companies in the US, as per the US rice exporters data and the US rice suppliers list for 2024-25, include:
|
Rank |
Company Name |
Approx. Export Value (2024) |
Top Export Markets |
|
1 |
Riceland Foods |
$1.3 billion |
Mexico, Haiti, Middle East |
|
2 |
Sun Valley Rice |
$150 million |
China, Japan, Canada |
|
3 |
ADM (Archer Daniels Midland) |
$120 million |
Latin America, Africa, Asia |
|
4 |
Riviana Foods |
$100 million |
Canada, Mexico, the Caribbean |
|
5 |
Farmers’ Rice Cooperative |
$80 million |
Japan, South Korea, Taiwan |
|
6 |
Kennedy Rice Mill |
$60 million |
Mexico, Canada, Central America |
|
7 |
Producers Rice Mill |
$55 million |
Haiti, Colombia, Saudi Arabia |
|
8 |
American Commodity Company |
$50 million |
Japan, Taiwan, Europe |
|
9 |
Gulf Pacific Rice Co. |
$40 million |
Mexico, Costa Rica, Panama |
|
10 |
Supreme Rice, LLC |
$35 million |
Cuba, Caribbean, West Africa |
U.S. Rice Export Categories: Top Exported Rice Varieties by the US
Based on the USDA report of US rice exports in 2024 and market data, US rice exports are categorized into three primary product types:
|
Rice Type |
Approx. Export Value (2024) |
|
Semi-milled/wholly milled rice (bleached) |
$1.4 billion |
|
Paddy (rough/unmilled) rice |
$821 million |
|
Husked (brown) rice |
$218 million |
These three types together account for approximately 99% of the total U.S. rice export value in 2024.
Insight Summary
-
Fully milled/bleached rice is the largest export by value, reaching around $1.4 billion in 2024-25.
-
Rough or paddy rice also remains significant at roughly $821 million.
-
Brown (husked) rice plays a smaller but notable role, with exports around $218 million.
US Rice Exports in the Last 10 Years: Historical US Rice Export Data
|
Year of Exports |
US Rice Export Value ($) |
|
2014 |
$1.99 billion |
|
2015 |
$2.01 billion |
|
2016 |
$1.79 billion |
|
2017 |
$1.71 billion |
|
2018 |
$1.69 billion |
|
2019 |
$1.86 billion |
|
2020 |
$1.87 billion |
|
2021 |
$1.92 billion |
|
2022 |
$1.70 billion |
|
2023 |
$2.01 billion |
|
2024 |
$2.43 billion |
|
2025 quarter 1 |
$573.13 million |
What's Changing in 2024–25?
-
U.S. long-grain rice exports fell 21% in the first 9 months of 2024–25.
-
Shipments to Mexico and Colombia dropped sharply.
-
Iraq, on the other hand, increased purchases of U.S. milled rice.
-
Total export forecast: about 4.2 million metric tons by mid-2025.
Price and Competition
-
U.S. rice export price: $650/ton (stayed firm).
-
Thai and Vietnamese rice prices dropped to $400/ton.
-
U.S. rice is more expensive than most global competitors.
-
Domestic farm price: $14.50 per cwt (only slightly down from 2023).
Trade Policy Moves
-
Japan eased rice import rules under WTO quotas.
-
U.S. supplies 45% of Japan’s duty-free quota.
-
But exports outside that quota still face heavy tariffs.
-
Mercosur countries (like Brazil) are pushing harder into U.S. markets in Latin America.
Looking Ahead
-
USDA predicts slightly lower exports for 2025–26.
-
U.S. rice will face more competition and pressure on prices.
-
Strong trade deals and stable demand from core buyers (like Japan and Mexico) will be key to staying competitive.
US Rice Production in 2024–25
In terms of rice production, the USA is ranked 13th in the world, as per the US rice production data. Arkansas, California, Louisiana, Mississippi, Missouri, and Texas are the principal rice-producing states in the United States. Around 222 million hundredweight (cwt) of rice were produced in the US in 2024, a 2% increase over 2023. An estimated 2.91 million acres were planted, a 1% increase over the previous year, while 2.87 million acres were harvested. Compared to 2023, the average rice production in US increased by 107 pounds to 7,748 pounds per acre.
Total Output & Yield of Rice Production in US
-
Production rose 2%, reaching 222.1 million hundredweight (cwt) in 2024–25, about 4.1 million cwt higher than the prior year, driven by improved yields. This is the largest output since the 2020/21 season.
-
Long-grain rice made up all of the production gain, contributing to an 8.5% increase in total supply to about 230.3 million cwt.
Acreage & Field Yield
-
Yield came in at a record 7,600 pounds per acre for long-grain.
-
Harvested area was slightly reduced in 2025/26, but for 2024/25 it supported full yield potential.
Supply Breakdown & Usage
-
Carry‑in stocks from previous years were up around 9.6 million cwt, bolstering overall supply.
-
Imports rose to about 6.5 million cwt, up roughly 1.9 million cwt, mainly medium- and short-grain.
-
Total domestic and residual use surged to a record 165.0 million cwt, indicating strong local demand and processing.
-
Ending stocks remained elevated at 43.5 million cwt, about 9% higher than in 2023/24.
Production by Rice Type
-
Long-grain accounted for virtually all of 2024–25 production growth.
-
Medium- and short-grain output stayed flat or slightly declined.
2025/26 Forecast Snapshot
-
USDA initially projected 2025/26 production at 219.3 million cwt, down about 1%, due to slightly lower planted acreage and marginally lower yield (7,727 lb/acre) compared to 2024.
-
A later revision lowered that forecast further to 205.0 million cwt, a 4% drop, based on updated acreage data (2.647 million acres harvested).
U.S. Rice Production (2024–25 vs 2025/26 projections)
|
Metric |
2024–25 (Actual) |
2025/26 (Forecast) |
|
Production |
222.1 M cwt |
205–219 M cwt |
|
Yield (long-grain avg.) |
7,625–7,746 lb/acre |
7,727 lb/acre |
|
Total Supply |
230.3 M cwt |
302.7–313.5 M cwt |
|
Domestic Use |
165.0 M cwt |
165–172 M cwt |
|
Imports |
6.5 M cwt |
49–50 M cwt |
|
Ending Stocks |
43.5 M cwt |
44.7–47.5 M cwt |
Key Considerations
-
Some stakeholders have questioned the accuracy of USDA’s acreage and carryover estimates, citing flooding impacts in northeastern Arkansas that potentially inflate supply assumptions.
-
While USDA numbers remain higher than expected in some states, hard NASS data support the final 222.1 M cwt figure.
Summary of US Rice Production
-
2024–25 saw a solid increase in U.S. rice production, thanks to better yields and steady acreage.
-
Most growth came in long-grain, with medium/short-grain flat.
-
Supplies remained high with modest imports and elevated carry-in stocks.
-
The 2025/26 outlook is lower, driven by smaller acreage and tighter supply.
Summary of US Rice Exports Statistics
|
Metric |
2024 Value |
2024–25 Trend |
|
Total Exports |
3.82 million tons |
Down 21% (long-grain) |
|
Export Revenue |
$2.42 billion |
Holding strong |
|
Price (Export) |
$650/ton |
Higher than competitors |
|
Top Buyers |
Mexico, Japan, Haiti |
Still strong |
|
Major Risk |
Brazil competition |
Growing in Latin America |
Conclusion and Bottom Line
In conclusion, the United States remains a major player in the global rice market, exporting large quantities of rice to countries around the world. The latest export data for 2024-25 highlights the strong demand for US rice on the international market, with countries such as China, Mexico, Japan, South Korea, and Nigeria being key importers. With its high-quality rice and advanced farming techniques, the US is well-positioned to continue its success as a leading exporter of rice in the years to come. U.S. rice exports are still strong in value but are facing real pressure in volume. To stay ahead, the U.S. must protect core markets, lower costs, and keep trade channels open.
The U.S. rice export sector remains resilient, especially in value terms. Yet, for the 2024/25 marketing year, a clear downturn in long-grain exports shows the vulnerability to regional competition and shifting demand. Price advantage remains limited, and milling margins are squeezed. Rising inventories and modest export forecasts for 2025/26 suggest that expanded market access, especially via reduced barriers in key markets like Japan, could be a key lever, as noted by economic modeling from the USITC, which estimates potential export gains of 40%+ if tariffs were removed.
We hope you liked our data-driven and insightful blog report on the topic of US rice exports by country for 2025. For the latest US import-export data or to search live data on US rice exports by country or company, visit USImportdata. Contact us at info@tradeimex.in to get a customized database report along with a verified list of the top rice exporters in the US, at your fingertips!
What's Your Reaction?


