US Pharmaceutical Import Data 2025: Top Pharmaceutical Importers in USA & Medicine Import Insights
Explore top pharmaceutical importers in the USA with US pharma imports by country, & verified US import data. Get insights into import opportunities & US pharma markets.
The United States is the world’s largest pharmaceutical market, accounting for a dominant share of global drug consumption and spending. Despite having a strong domestic pharmaceutical manufacturing base, the U.S. relies heavily on imports for finished medicines, active pharmaceutical ingredients (APIs), vaccines, biologics, and specialty drugs. In 2025, pharmaceutical imports continued to be a critical pillar of the U.S. healthcare system, supply chain stability, and drug pricing structure. According to the latest US import data and the pharmaceutical import data of the USA, the total value of US pharmaceutical imports reached $212.66 billion in 2024, a 20% increase from the previous year. According to the US pharmaceutical import data, the US imported pharmaceuticals worth $167.63 billion in the first three quarters of 2025.
The USA is the largest pharmaceutical importer in the world, according to global trade data. This article presents a data-driven & in-depth analysis of US pharmaceutical import data in 2025, covering import values, top supplying countries, leading pharmaceutical importers, major drug categories, and key structural trends shaping medicine imports into the United States.
Overview of the U.S. Pharmaceutical Import Market in 2025
The U.S. pharmaceutical import market is both large and complex. Imports serve multiple purposes:
-
Filling gaps in domestic production
-
Supplying patented and specialty medicines produced abroad
-
Supporting cost-efficient sourcing of generics and APIs
-
Ensuring access to vaccines, biologics, and advanced therapies
Total Pharmaceutical Import Value (2025)
In 2025:
-
Total U.S. pharmaceutical imports were estimated at USD 190–205 billion.
-
Pharmaceutical products ranked among the top three imported product categories by value.
-
Medicines alone accounted for over 8% of total U.S. goods imports.
-
Imports continued to grow compared to 2024, driven by rising demand for biologics, oncology drugs, immunotherapies, & treatments for chronic diseases.
US Pharmaceutical Imports by Country: Where Does the US Import Pharmaceuticals From?
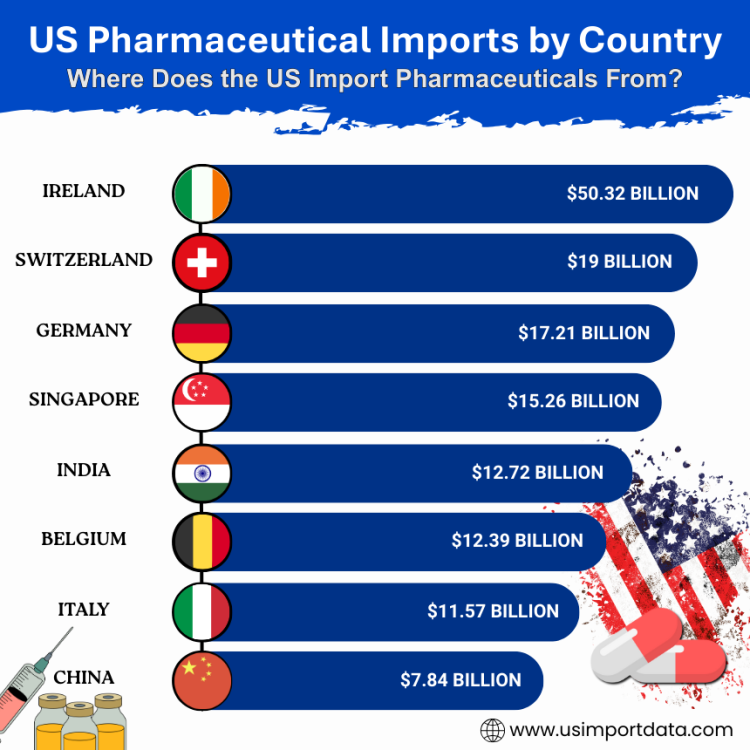
US Pharmaceutical Imports by Country consist of a diverse range of nations that supply pharmaceutical products to the United States. According to data, the US predominantly imports pharmaceuticals from countries like Ireland, Germany, Switzerland, and India. These countries are well-respected for their high-quality pharmaceutical products and contribute significantly to meeting the healthcare needs of the American population. The top 10 pharmaceutical supplying countries to the USA, as per the US shipment data for 2025, include:
1. Ireland: $50.32 billion (23.7%)
Ireland is one of the leading suppliers of pharmaceutical products to the United States, accounting for a substantial percentage of the total imports. The country is home to many pharmaceutical companies, including some of the world's largest. Ireland's expertise in pharmaceutical manufacturing and research makes it a key player in the global pharmaceutical industry.
2. Switzerland: $19 billion (8.9%)
Switzerland is another significant contributor to the US pharmaceutical imports market. The country is known for its high-quality pharmaceutical products and cutting-edge research in the field. Swiss pharmaceutical companies have a strong presence in the US market, supplying a wide range of innovative medications to meet the healthcare needs of Americans.
3. Germany: $17.21 billion (8.1%)
Germany is renowned for its advanced healthcare system and robust pharmaceutical industry. The country's pharmaceutical exports to the US include a diverse range of products, from over-the-counter medications to cutting-edge biopharmaceuticals. German pharmaceutical companies are known for their commitment to quality and innovation, making them trusted partners in the US market.
4. Singapore: $15.26 billion (7.2%)
Singapore has emerged as a key player in the global pharmaceutical trade, thanks to its strategic location and world-class infrastructure. The country's pharmaceutical exports to the US encompass a wide range of products, including generics, specialty drugs, and medical devices. Singapore's efficient regulatory system and skilled workforce make it an attractive partner for US pharmaceutical imports.
5. India: $12.72 billion (6%)
India has a strong presence in the US pharmaceutical market, supplying a diverse range of generic medications and active pharmaceutical ingredients, as per the data on US pharmaceutical imports from India. The country's cost-effective manufacturing capabilities and skilled workforce have made it a preferred destination for pharmaceutical imports. Indian pharmaceutical companies are known for their competitiveness and compliance with international quality standards.
6. Belgium: $12.39 billion (5.8%)
Belgium is a key supplier of pharmaceutical products to the United States, with a focus on innovative medications and biopharmaceuticals, as per the data on US pharmaceutical imports from Belgium by HS code. The country's strategic location in Europe and advanced healthcare infrastructure have helped it become a major player in the global pharmaceutical trade. Belgian pharmaceutical companies are known for their research-driven approach and high-quality products.
7. Italy: $11.57 billion (5.4%)
Italy is known for its rich pharmaceutical heritage and expertise in developing high-quality medications. The country's pharmaceutical exports to the US encompass a wide range of products, from traditional medicines to cutting-edge biologics. Italian pharmaceutical companies are valued for their focus on research and development, as well as their commitment to patient care.
8. China: $7.84 billion (3.7%)
China is a growing player in the US pharmaceutical market, with a focus on supplying generic medications and active pharmaceutical ingredients. The country's vast manufacturing capabilities and competitive pricing have made it a significant contributor to US pharmaceutical imports. Chinese pharmaceutical companies are increasingly investing in research and innovation to enhance their global competitiveness.
9. Japan: $7.42 billion (3.5%)
Japan is known for its advanced healthcare system and innovative pharmaceutical industry. The country's pharmaceutical exports to the US include a wide range of products, from traditional herbal medicines to cutting-edge biopharmaceuticals. Japanese pharmaceutical companies are respected for their focus on quality and patient safety, making them trusted suppliers in the US market.
10. United Kingdom: $7.29 billion (3.4%)
The United Kingdom is a longstanding partner in the US pharmaceutical market, supplying a diverse range of medications and healthcare products. The country's pharmaceutical exports to the US benefit from its strong regulatory framework and emphasis on quality control. British pharmaceutical companies are known for their innovation and commitment to advancing medical research.
Top Pharmaceutical Importing Companies in the USA: US Pharmaceutical Importers Database
The US Pharmaceutical Importers Database is a valuable resource for businesses seeking to partner with leading pharmaceutical importers in the United States. This database compiles information on the top-tier companies importing pharmaceutical products into the country, allowing for efficient and strategic collaboration opportunities. Pharmaceutical imports are dominated by large multinational corporations and specialized distributors. Key pharma importer categories of the US include:
-
Multinational pharmaceutical companies
-
Generic drug manufacturers
-
Biologics and specialty drug firms
-
Large pharmaceutical distributors
-
Hospital supply organizations
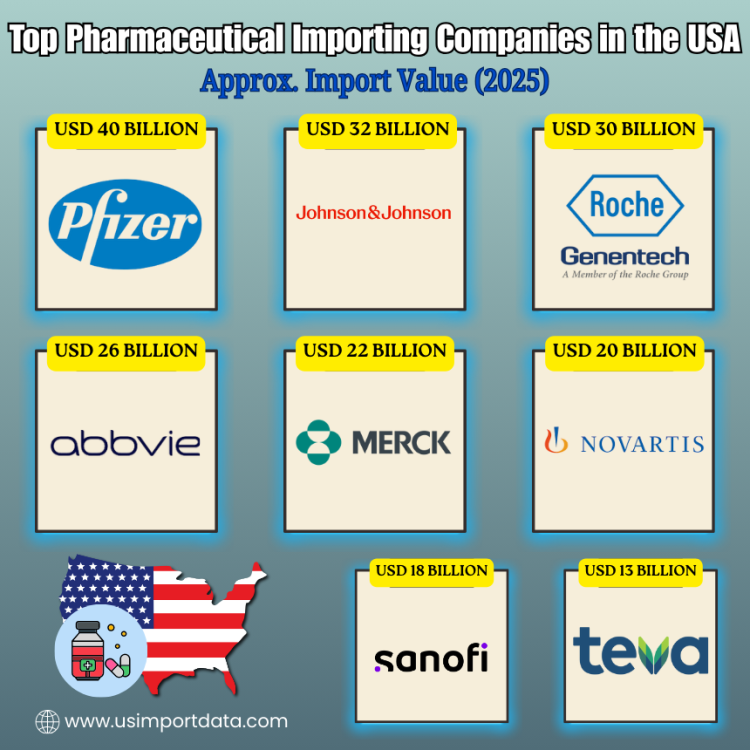
The leading pharmaceutical importers in the USA, as per the US pharmaceutical importers data & pharmaceutical buyers list for 2025, include:
|
Rank |
Company Name |
Approx. Import Value (2025) |
Top Imported Pharmaceutical Types |
Top Import Source Countries |
|
1 |
USD 40 Billion |
Vaccines, oncology drugs, immunology, injectables |
Ireland, Belgium, Germany |
|
|
2 |
Johnson & Johnson (Janssen) |
USD 32 Billion |
Biologics, oncology, & autoimmune drugs |
Ireland, Switzerland, Netherlands |
|
3 |
Roche Group (Genentech USA) |
USD 30 Billion |
Oncology biologics, monoclonal antibodies |
Switzerland, Germany |
|
4 |
AbbVie Inc. |
USD 26 Billion |
Immunology biologics, specialty injectables |
Ireland, Germany |
|
5 |
Merck & Co. |
USD 22 Billion |
Vaccines, oncology, & cardiovascular medicines |
Ireland, Italy, France |
|
6 |
Novartis USA |
USD 20 Billion |
Oncology drugs, gene therapies, biosimilars |
Switzerland, Germany |
|
7 |
Sanofi US |
USD 18 Billion |
Vaccines, diabetes drugs, & rare disease medicines |
France, Germany |
|
8 |
Teva Pharmaceuticals USA |
USD 13 Billion |
Generic tablets, injectables, APIs |
India, Israel, Hungary |
|
9 |
Viatris (Mylan) |
USD 12 Billion |
Generic medicines, APIs, & injectables |
India, Germany, Italy |
|
10 |
Bristol Myers Squibb |
USD 11 Billion |
Oncology, cardiovascular, & immunotherapies |
Ireland, Belgium |
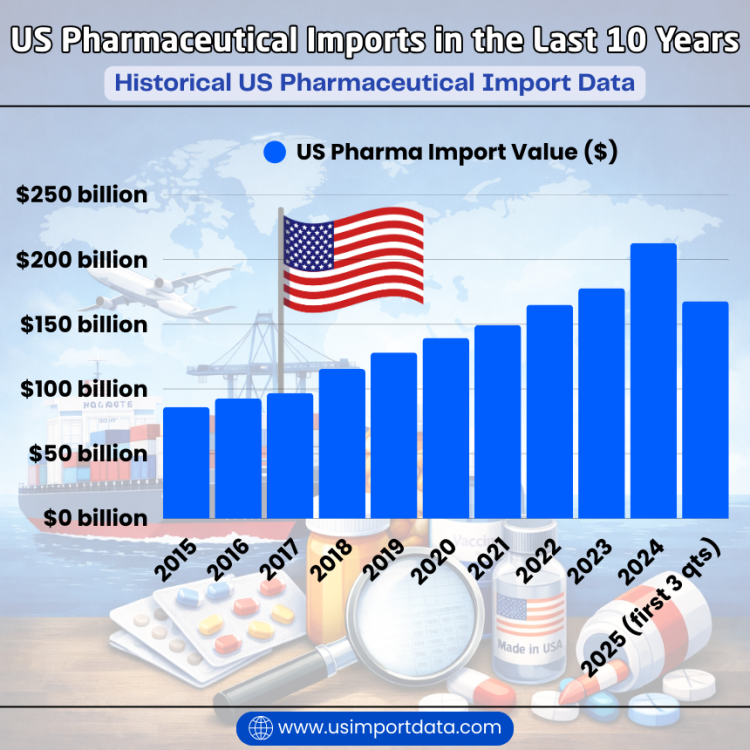
US Pharmaceutical Imports in the Last 10 Years: Historical US Pharmaceutical Import Data
|
Year of Imports |
US Pharma Import Value ($) |
|
2015 |
$86.03 billion |
|
2016 |
$92.51 billion |
|
2017 |
$96.87 billion |
|
2018 |
$115.52 billion |
|
2019 |
$128.13 billion |
|
2020 |
$139.43 billion |
|
2021 |
$149.41 billion |
|
2022 |
$164.99 billion |
|
2023 |
$177.84 billion |
|
2024 |
$212.66 billion |
|
2025 (first 3 quarters) |
$167.63 billion |
Why the US Imports So Many Pharmaceuticals
Despite being home to leading pharmaceutical companies, the U.S. imports heavily due to structural factors:
Globalized Drug Manufacturing
Modern pharmaceutical production is fragmented:
-
APIs may be produced in Asia.
-
Formulation may occur in Europe.
-
Packaging and labeling may happen elsewhere.
The U.S. often imports finished dosage forms, not just raw ingredients.
Cost and Specialization
-
Generic drugs are more cost-efficiently produced in countries with lower manufacturing costs.
-
High-value biologics are concentrated in specific advanced manufacturing hubs.
Regulatory and Patent Structures
-
Many patented drugs are manufactured only in specific countries.
-
FDA-approved overseas plants supply exclusive or limited-source medicines.
Top Pharmaceutical Import Categories in the USA (2025)
U.S. pharmaceutical imports span a wide range of products. In 2025, imports were dominated by high-value finished medicines.
Major Import Categories by Value Share
-
Finished pharmaceutical formulations: 58–60%
-
Biologics and immunotherapies: 20–22%
-
Vaccines: 6–7%
-
Active Pharmaceutical Ingredients (APIs): 7–8%
-
Blood products and plasma derivatives: 4–5%
-
Other pharmaceutical preparations: 3–4%
Finished Pharmaceutical Products: Largest Import Segment
Finished medicines remained the largest import category.
Key Imported Finished Dosage Forms
-
Tablets and capsules
-
Injectables
-
Oncology drugs
-
Cardiovascular medicines
-
Diabetes treatments
-
Neurological and psychiatric drugs
In 2025:
-
Finished pharmaceutical imports exceeded USD 115 billion.
-
Growth was strongest in specialty and chronic disease medicines.
-
Injectables and complex formulations showed faster growth than oral solids.
High-value branded drugs contributed disproportionately to import value despite lower shipment volumes.
Biologics, Specialty Drugs, and Advanced Therapies
Biologics continued to reshape the U.S. pharmaceutical import landscape.
Key Biologic Imports
-
Monoclonal antibodies
-
Immunotherapies
-
Oncology biologics
-
Autoimmune disease treatments
-
Enzyme replacement therapies
In 2025:
-
US Biologic imports exceeded USD 40 billion.
-
Represented less than 10% of volume but over 20% of value.
-
The average per-unit import value was many times higher than that of traditional generics.
The U.S. relied heavily on imports from Europe for biologics due to specialized manufacturing capabilities.
Vaccine Imports in 2025
Vaccines remained a stable but strategically important import category.
-
Vaccine imports were valued at USD 11–14 billion
-
Demand was driven by:
-
Seasonal immunization programs
-
Pediatric vaccines
-
Travel and adult immunizations
-
Most vaccines were imported in finished, ready-to-use form.
The U.S. continued to maintain diversified sourcing to reduce supply risk.
Active Pharmaceutical Ingredients (API) Imports
While APIs account for a smaller share of total value, they are critical for domestic drug manufacturing.
API Import Characteristics
-
APIs accounted for USD 14–16 billion in imports.
-
High-volume, low-margin segment.
-
Essential for generics and hospital medicines.
Key API Categories
-
Antibiotics
-
Pain management drugs
-
Cardiovascular APIs
-
Diabetes-related APIs
The U.S. remained dependent on foreign API suppliers, particularly for essential medicines.
Why Ireland Dominates U.S. Pharmaceutical Imports
Ireland has become the single largest source of pharmaceutical imports to the U.S., as per the data on Ireland pharmaceutical exports to the US.
Key Reasons
-
Concentration of multinational pharmaceutical manufacturing.
-
Favorable tax and regulatory environment.
-
Specialization in high-value branded drugs and biologics.
In 2025:
-
Pharmaceutical imports from Ireland exceeded USD 40 billion.
-
Average shipment value was among the highest globally.
-
Products included oncology drugs, immunotherapies, and cardiovascular medicines.
US Medicine Import Trends Observed in 2025
Shift Toward High-Value Medicines
Growth was strongest in:
-
Oncology
-
Autoimmune diseases
-
Rare disease treatments
Volume vs Value Gap
-
Generics dominated volume
-
Biologics dominated value
Supply Chain Risk Awareness
-
Increased inventory buffers
-
Greater focus on supplier diversification
-
More scrutiny of the API origin
Regulatory and Policy Environment
U.S. pharmaceutical imports are shaped by:
-
FDA inspection and approval processes
-
Drug pricing and reimbursement systems
-
Trade and industrial policy considerations
In 2025:
-
Regulatory standards remained strict
-
Compliance costs favored established suppliers
-
Smaller exporters faced higher entry barriers
Challenges in the U.S. Pharmaceutical Import Market
Supply Chain Vulnerability
-
High dependence on a few countries for critical drugs
-
API concentration risks
Pricing Pressure
-
Imported drugs contribute to rising healthcare costs.
-
Specialty drug prices remain a policy concern.
Manufacturing Concentration
-
Limited redundancy in global pharma manufacturing.
Outlook for US Pharmaceutical Imports Beyond 2025
Looking ahead:
-
Pharmaceutical imports are expected to continue growing.
-
Biologics and specialty medicines will drive value.
-
Generics and APIs will remain import-dependent.
-
Nearshoring will supplement but not replace imports.
The U.S. pharmaceutical market will remain deeply integrated into global supply chains.
Conclusion and Final Thoughts
In conclusion, the U.S. pharmaceutical import data for 2025 highlights a healthcare system that is both advanced and globally dependent. Imports worth nearly USD 200 billion supplied essential medicines, life-saving biologics, vaccines, and affordable generics to American patients. While Ireland, Germany, Switzerland, & India dominated supply by value & volume, the broad import ecosystem reflected deep interdependence across continents. In 2025, pharmaceutical imports were not simply trade flows; they were a cornerstone of public health, economic stability, and innovation in the United States.
For more insights into the latest US export-import data, or to search live data on US pharmaceutical imports by country, visit USImportdata. Contact us at info@tradeimex.in for customized trade reports, market insights, and a verified database of the top pharmaceutical importers in the USA, tailored to your requirements.
What's Your Reaction?