US Fish Import Data 2025: Exploring the Top Fish Importers in USA
Explore US fish imports, leading fish importers in the USA, fish HS code details, and country-wise seafood trade data with updated market analysis.
The United States remains one of the most influential players in the global fish & seafood trade. Despite having vast coastlines, advanced fishing fleets, and a sizable domestic seafood industry, the country depends heavily on imports to meet consumer demand. In 2024–25, this reliance became even more pronounced as seafood consumption stayed strong while domestic production growth remained limited. According to the latest US import data & fish import data of the USA, the total value of US fish imports reached $21.02 billion in 2024, a 1% decline from the previous year. According to the latest US fish import data, the US imported fish worth $16.85 billion in the first three quarters of 2025. The global seafood trade continues to expand, with rising demand attracting numerous frozen fish importers across international markets. The USA fish market plays a major role in this growth, driven by high consumer demand, diverse seafood consumption, and a strong distribution network.
Size and Structure of the US Fish Import Market
Overall Market Value
In 2024, total U.S. fish and seafood imports were valued at approximately USD 26–27 billion, making the United States the largest seafood-importing country in the world by value. Although import value showed a slight decline compared to the post-pandemic highs of 2022–23, volumes remained historically strong, as per the Sustainable Fisheries UW report.
Early trade data from 2025 indicates that U.S. fish imports have stabilized rather than contracted. Monthly imports consistently ranged between USD 2 and 2.4 billion, suggesting sustained consumer demand and steady replenishment of retail and foodservice inventories.
Import Dependency
The U.S. imports over 70 percent of the seafood it consumes. This dependency exists for several reasons:
-
Domestic fisheries face quota limits and sustainability regulations
-
Aquaculture growth in the U.S. remains slower than that of global competitors
-
Labor and operating costs are higher compared to exporting nations
-
U.S. consumers demand a wide variety of species that are not locally available
As a result, imports remain structurally necessary, not optional.
US Fish Imports by Country: Where Does the US Import Fish From?
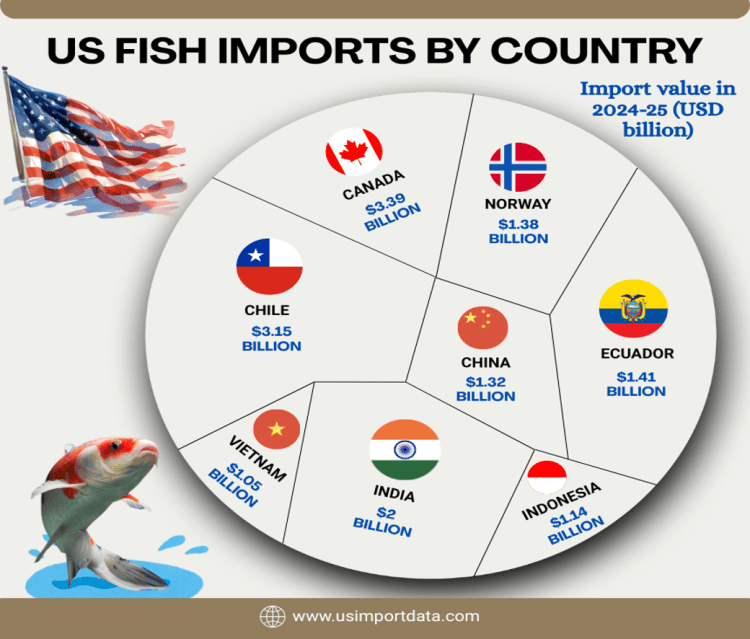
US fish imports by country reveal a diverse range of sources for the seafood consumed in the United States. When it comes to seafood consumption, the United States is one of the largest markets globally. With its vast coastline and diverse marine resources, the US relies heavily on imported fish to meet the demands of its consumers. But where exactly does the US import fish from? The US imports fish from a variety of countries, with top contributors including Canada, Chile, China, India, & Norway. These countries play a significant role in meeting the demand for seafood within the US market. The top 10 fish supplying countries to the USA, as per the US shipment data for 2025, include:
1. Canada: $3.39 billion (16.2%)
Canada is the largest exporter of fish to the United States, accounting for 16.2% of total fish imports. With its pristine water bodies and strict regulations on fishing practices, Canada is known for supplying high-quality seafood products to the US market. Popular fish species imported from Canada include salmon, lobster, and snow crab.
2. Chile: $3.15 billion (15%)
Chile is another major player in the US fish market, providing 15% of total fish imports. The long coastline of Chile and its well-developed aquaculture industry make it a key supplier of salmon, trout, and mussels to the US. Chilean sea bass, in particular, is a sought-after delicacy that is highly prized by US consumers.
3. India: $2 billion (9.5%)
India is a rising star in the global seafood market, with a 9.5% share of US fish imports. The country is known for its diverse range of fish species, including shrimp, tilapia, and catfish. Indian seafood products are valued for their affordability and unique flavors, making them popular in American kitchens.
4. Ecuador: $1.41 billion (6.7%)
Ecuador is a major supplier of shrimp and tuna to the US, accounting for 6.7% of total fish imports. The country's location on the equator gives it access to rich fishing grounds, enabling it to produce high-quality seafood products for the US market. Ecuadorian shrimp, in particular, is highly regarded for its sweet taste and firm texture.
5. Norway: $1.38 billion (6.6%)
Norway is renowned for its salmon production, making it a significant player in the US fish market with a 6.6% share of imports. Norwegian salmon is prized for its superior quality and taste, making it a top choice for American consumers. In addition to salmon, Norway also exports other fish species such as cod and herring to the US.
6. China: $1.32 billion (6.3%)
China is a major supplier of processed seafood products to the US, accounting for 6.3% of total fish imports, as per the data on US fish imports from China. While China's reputation for food safety has raised concerns among consumers, the country remains a key source of shrimp, tilapia, and squid for the US market. Chinese seafood products are valued for their affordability and convenience.
7. Indonesia: $1.14 billion (5.5%)
Indonesia is a leading exporter of tuna and shrimp to the United States, with a 5.5% share of fish imports. The country's abundant marine resources and low-cost labor make it a competitive player in the global seafood market. Indonesian tuna, in particular, is highly prized for its quality and freshness.
8. Vietnam: $1.05 billion (5%)
Vietnam is known for its extensive aquaculture industry, supplying a variety of fish species to the US market with a 5% share of imports, as per the data on the US fish imports from Vietnam by HS code. Vietnamese pangasius, also known as basa or swai, is a popular choice among American consumers due to its mild flavor and affordable price. Vietnam also exports other seafood products, such as shrimp and crab, to the US.
9. Mexico: $467.10 million (2.2%)
Mexico is a key supplier of shrimp, tuna, and other seafood products to the United States, accounting for 2.2% of total fish imports. The country's proximity to the US market and its rich marine resources make it a convenient source of fresh and frozen seafood for American consumers. Mexican shrimp, in particular, is highly valued for its sweet taste and tender texture.
10. Japan: $455.57 million (2.2%)
Japan is a major exporter of high-quality seafood products to the US, with a 2.2% share of fish imports. Japanese seafood is renowned for its freshness, quality, and unique flavors, making it a top choice for discerning American consumers. Popular Japanese fish imports include sushi-grade tuna, mackerel, and squid.
Top Fish Importing Companies in the USA: US Fish Importers Database
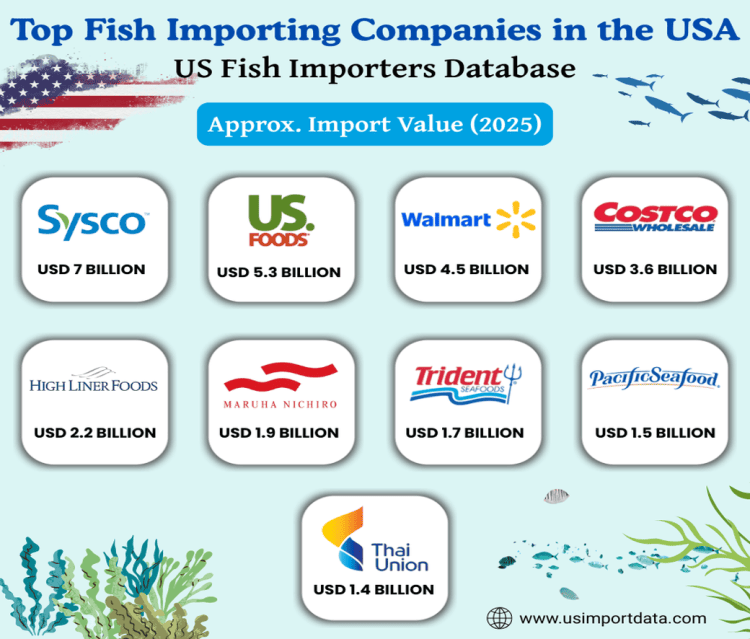
The US Fish Importers Database is a valuable resource for businesses looking to partner with leading fish importers in the United States. This database offers a comprehensive list of top fish importing companies, providing detailed information on their products, shipment data, and market presence. As a result, many US fish import companies actively source products from leading exporting countries, ensuring a steady supply of frozen and processed fish to meet both retail and food service industry needs across the United States. The leading fish importers in the USA, as per the US fish buyers list & fish importers data for 2025, include:
|
Company Name |
Approx. Import Value (2025) |
Top Import Types |
Top Import Sources |
|
USD 7 billion |
Shrimp, salmon, whitefish fillets, tuna, frozen fish |
Canada, Chile, India, Vietnam, Indonesia |
|
|
US Foods Holding Corp. |
USD 5.3 billion |
Shrimp, salmon, cod, pollock, value-added fish |
Canada, Chile, India, Norway, Vietnam |
|
Walmart Inc. |
USD 4.5 billion |
Frozen fish, shrimp, salmon, canned tuna |
India, Vietnam, Indonesia, Chile, China |
|
Costco Wholesale Corp. |
USD 3.6 billion |
Salmon, shrimp, crab, lobster, premium frozen fish |
Canada, Chile, Norway, India, Ecuador |
|
High Liner Foods USA |
USD 2.2 billion |
Frozen whitefish, breaded fish, fillets |
Canada, China, Vietnam, Iceland |
|
Maruha Nichiro USA |
USD 1.9 billion |
Tuna, pollock, salmon, processed fish |
Japan, Thailand, Vietnam, Russia |
|
Trident Seafoods |
USD 1.7 billion |
Pollock, cod, salmon, crab |
Russia, China, Canada, Vietnam |
|
Pacific Seafood Group |
USD 1.5 billion |
Shrimp, salmon, tuna, frozen fillets |
Indonesia, Vietnam, Chile, Mexico |
|
Thai Union North America |
USD 1.4 billion |
Canned tuna, shrimp, value-added seafood |
Thailand, Vietnam, Indonesia, India |
|
Cooke Aquaculture USA |
USD 1.2 billion |
Fresh and frozen salmon, whitefish |
Canada, Chile, Scotland |
Key Observations
-
Foodservice giants dominate: Sysco and US Foods alone account for nearly 40% of total imports among the top 10.
-
Shrimp and salmon lead imports across nearly all companies.
-
Asia remains the primary sourcing region, especially India, Vietnam, Indonesia, and Thailand.
-
Canada and Chile dominate high-value fresh seafood, particularly lobster and salmon.
-
Retailers like Walmart and Costco focus more on frozen, packaged, and private-label seafood.
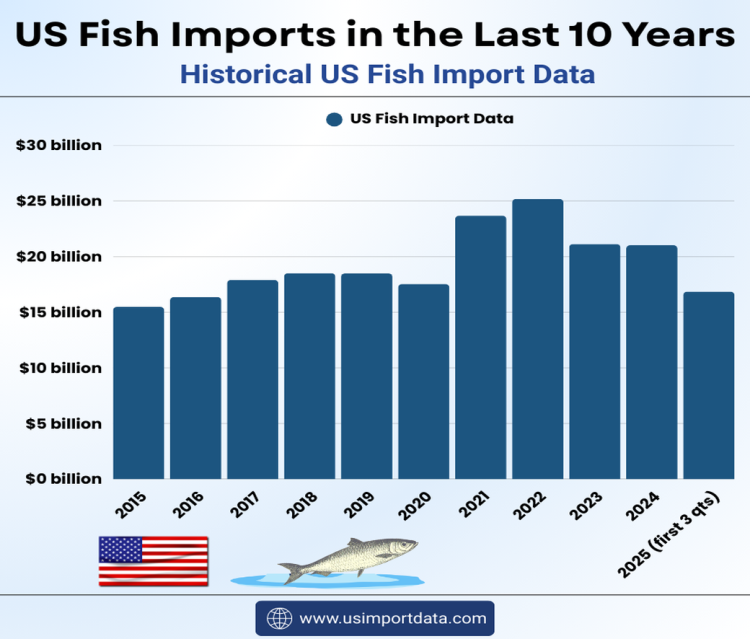
US Fish Imports in the Last 10 Years: Historical US Fish Import Data
|
Year of Imports |
US Fish Import Data |
|
2015 |
$15.48 billion |
|
2016 |
$16.36 billion |
|
2017 |
$17.90 billion |
|
2018 |
$18.51 billion |
|
2019 |
$18.49 billion |
|
2020 |
$17.53 billion |
|
2021 |
$23.68 billion |
|
2022 |
$25.18 billion |
|
2023 |
$21.13 billion |
|
2024 |
$21.02 billion |
|
2025 (first 3 quarters) |
$16.85 billion |
Fish vs Shellfish: What Dominates U.S. Imports?
Although the term “fish imports” is often used broadly, the U.S. import basket is divided into finfish and shellfish, each with distinct patterns.
Shellfish Imports
Shellfish accounts for over 50 percent of the total seafood import value, largely driven by shrimp.
-
Shrimp alone represents approximately 30–35 percent of the total seafood import value, as per the US seafood importers data.
-
Most shrimp is imported frozen, peeled, or processed.
-
The U.S. imports far more shrimp than it exports or produces domestically.
Finfish Imports
Finfish imports are led by:
-
Salmon
-
Tuna
-
Pollock
-
Cod
-
Pangasius (basa)
Finfish imports are divided between fresh, frozen, and value-added products, including fillets, portions, and prepared meals.
Most Imported Fish Species in the U.S.
1. Shrimp
-
Most consumed seafood in the U.S.
-
Over 90 percent imported
-
Primarily sourced from India, Ecuador, Indonesia, and Vietnam
Shrimp imports exceeded 700,000 metric tons in 2024, making it the backbone of the U.S. seafood trade.
2. Salmon
-
Second most popular seafood
-
Imports dominate the domestic supply
-
Chile and Canada are the primary suppliers
Salmon imports are valued highly due to strong demand from health-conscious consumers.
3. Tuna
-
Imported as fresh, frozen, canned, and processed
-
Key suppliers include Indonesia, Vietnam, and Thailand
-
Used heavily in foodservice and ready-to-eat products
4. Whitefish (Cod, Pollock, Pangasius)
Whitefish imports support:
-
Fish fillets
-
Fish sticks
-
Institutional food programs
Pangasius, in particular, remains popular due to its low price and consistent quality.
Major U.S. Ports Handling Fish Imports
Fish imports enter the U.S. through a network of high-volume ports.
Top Ports by Volume and Value
-
Los Angeles / Long Beach – Primary gateway for Asian seafood
-
New York / New Jersey – Major hub for fresh and frozen fish
-
Miami – Key entry point for Latin American seafood
-
Seattle / Tacoma – Strong presence of salmon and crab
-
Houston – Growing hub for shrimp and frozen fish
These ports are equipped with specialized cold storage and inspection facilities, which are essential for handling seafood.
Regulatory Environment Affecting Fish Imports
U.S. fish imports are governed by strict compliance requirements:
-
Mandatory seafood traceability reporting
-
Health and safety inspections
-
Anti-dumping and countervailing duties
-
Sustainability and labor compliance expectations
While these regulations increase costs for exporters, they also raise quality standards across the market.
Trends Shaping 2025 and Beyond
Several trends are likely to define U.S. fish imports in the near future:
1. Stable Demand, Moderate Growth
Consumption remains strong, but price sensitivity has increased.
2. Shift Toward Value-Added Products
Processed fillets, ready-to-cook, and seasoned fish products are growing faster than raw fish.
3. Greater Supply Chain Transparency
Buyers increasingly demand origin documentation and sustainability certifications.
4. Supplier Diversification
Importers are reducing reliance on a single country and expanding sourcing across Asia and Latin America.
Conclusion and Final Words
In conclusion, the U.S. fish import market in 2024–25 remains vast, complex, and globally interconnected. Canada, Chile, India, Indonesia, and Vietnam dominate supply, while shrimp and salmon anchor consumption. Despite regulatory pressures and global trade uncertainty, imports continue to be the backbone of the U.S. seafood industry. For exporters, traders, and market analysts, understanding these data-driven trends is essential. The U.S. will continue to rely on international fish suppliers, making it one of the most important and competitive seafood import markets in the world.
We hope that you liked our data-driven and detailed blog report on the US fish import data 2025. For more insights into the latest US export-import data, or to search live data on US fish imports by country, visit USImportdata. Contact us at info@tradeimex.in for customized trade reports, market insights, and a verified database of the top fish importers in the USA, tailored to your requirements.
What's Your Reaction?