US Polypropylene Import Report Under HS Code 39021000 & Plastic Granules Buyers Database
Discover verified PP granules buyers database by HS Code 39021000. Access US polypropylene import data, plastic granules import trends & connect with plastic granules buyers in the USA.
Polypropylene is a backbone polymer for the U.S. manufacturing economy. From food packaging and automotive interiors to medical disposables and industrial components, polypropylene in primary form is consumed in massive volumes every year. According to the latest US import data and polypropylene import data of the USA, the total value of the US polypropylene & pp granule imports reached $686.93 million in 2024, an 18% increase from the previous year. According to the US polypropylene import data by HS code 39021000, the US imported polypropylene worth $514.81 million in the first 11 months of 2025.
Despite strong domestic production, the United States continues to import large quantities of polypropylene granules under HS Code 39021000 to meet demand, manage price volatility, and access specialty grades. The USA is the 11th largest polypropylene & plastic granules importer in the world, as per the global trade data. This report presents a data-driven analysis of U.S. polypropylene imports in 2025, supported by historical customs figures, shipment-level trends, pricing benchmarks, and buyer intelligence. It also explains how a plastic granules buyers database is used by exporters and traders to convert trade data into sales.
HS Code 39021000 – Product Scope
HS Code: 39021000
Product Description: Polypropylene in primary forms. Includes:
-
Polypropylene granules
-
Polypropylene pellets
-
Polypropylene resin
-
Polypropylene powder
Excludes:
-
Finished plastic products
-
Molded items
-
Films, sheets, or pipes
This HS code is the core identifier used by customs authorities to record imports of polypropylene raw material.
US Polypropylene Import Market – Size & Scale
Latest Available Full-Year Import Data (2025 Baseline)
|
Metric |
Value |
|
Total Import Value |
USD 580–590 million |
|
Total Import Quantity |
415,000–420,000 metric tons |
|
Average Import Price |
USD 0.82–0.95 per kg |
|
Number of Import Shipments |
45,000+ shipments/year |
|
Active US Importers |
700+ companies |
This confirms that US polypropylene imports are not marginal. They are a structurally important part of the U.S. plastics supply chain.
US Import Value & Volume: What 2023–2025 Data Reveals
Quantitative Snapshot (2023)
-
Total import weight: 416,793,000 kg
-
Total value: $584.5 million (USD)
-
Top partners: Canada, South Korea, Germany, Belgium, Japan.
From an import perspective, this volume confirms that HS Code 39021000 polypropylene is imported extensively across multiple ports and supplier regions, a pattern likely to continue into 2025 due to sustained industrial activity.
Trends Shaping 2024–2025 Trade Flows
While global PP prices fluctuate with oil feedstock prices, capacity expansions in domestic and international petrochemical plants also shape import needs. Countries with strong export feedstock capability (Gulf, East Asia, Western Europe) benefit from scale and export pricing. US buyers leverage this competition to reduce procurement costs.
Trade data from proprietary platforms suggests that:
-
Import shipments tracked globally under 39021000 declined slightly in some regions, but overall still show strong buyer engagement.
-
Increasing buyer numbers signal recovery and demand diversification post-pandemic.
US Polypropylene Imports by Country: Where Does the US Import PP Granules From?
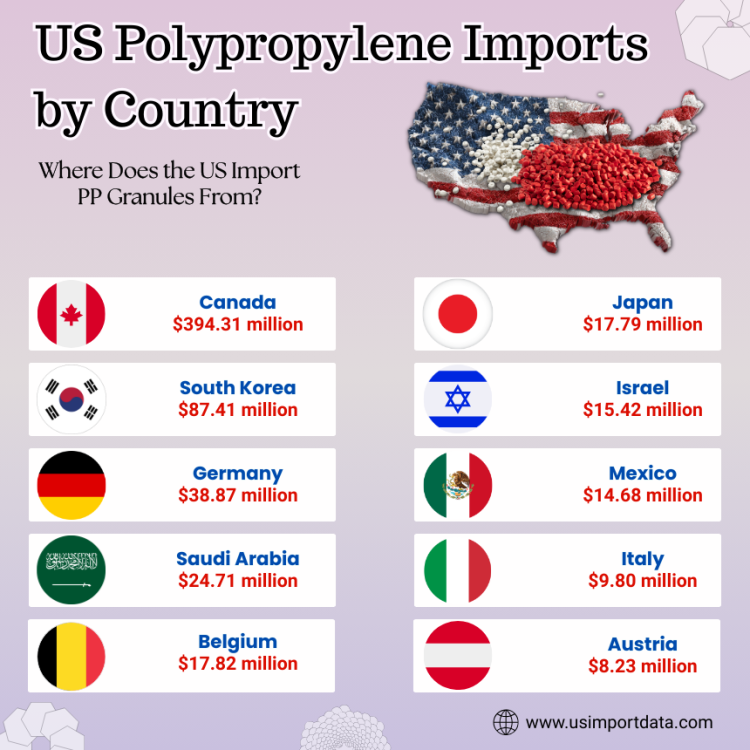
US Polypropylene Imports by Country reveal that the United States sources PP granules from various countries worldwide. Major contributors to US polypropylene imports include Canada, South Korea, Germany, and Saudi Arabia. These countries play a pivotal role in meeting the demand for polypropylene in the US market. The strategic import of PP granules from diverse sources ensures a stable supply chain and a competitive market environment, enhancing the availability of polypropylene for various industries within the United States. The top 10 countries from which the US imports polypropylene under HS code 39021000, as per the US shipment data for 2025, include:
1. Canada: $394.31 million (57.4%)
Canada stands out as the largest supplier of polypropylene to the United States, accounting for over half of the total imports. With its proximity and strong trade relations with the US, Canada plays a significant role in meeting the demand for polypropylene in various industries.
2. South Korea: $87.41 million (12.7%)
South Korea is another major source of polypropylene imports for the US market. Known for its advanced technology and high-quality products, South Korean suppliers play a crucial role in providing polypropylene and PP granules to meet the diverse needs of US manufacturers, as per the data on US polypropylene imports from South Korea.
3. Germany: $38.87 million (5.7%)
Germany, a powerhouse in the European plastics industry, is also a key contributor to the US polypropylene market, as per the data on US polypropylene imports from Germany by HS code. German suppliers are known for their expertise in manufacturing high-grade polypropylene materials, making them a valuable source for US importers.
4. Saudi Arabia: $24.71 million (3.6%)
As a major player in the global petrochemical industry, Saudi Arabia is a significant supplier of polypropylene to the US market. With its abundant oil reserves and advanced production facilities, Saudi Arabian manufacturers play a vital role in meeting the demand for polypropylene in the US.
5. Belgium: $17.82 million (2.6%)
Belgium, located in the heart of Europe, serves as another important source of polypropylene imports for the US. Belgian suppliers offer a wide range of polypropylene products, catering to the specific requirements of US customers across various industries.
6. Japan: $17.79 million (2.6%)
Japan, known for its innovation and high-quality manufacturing practices, is a key player in the global polypropylene market. Japanese suppliers provide the US market with a diverse range of polypropylene materials, meeting the stringent quality standards set by US manufacturers.
7. Israel: $15.42 million (2.2%)
Israel may be a smaller player compared to other major suppliers, but it still plays a significant role in the US polypropylene market. Israeli suppliers offer niche polypropylene products that cater to specific industry needs, making them a valuable source for US importers.
8. Mexico: $14.68 million (2.1%)
Mexico, the US's neighbor to the south, is an important source of polypropylene imports for the US market. With its proximity and strong trade ties with the US, Mexican suppliers provide a convenient and reliable source of polypropylene materials for US manufacturers.
9. Italy: $9.80 million (1.4%)
Italy, known for its craftsmanship and design excellence, also contributes to the US polypropylene market. Italian suppliers offer a range of high-quality polypropylene products that cater to the aesthetic and performance requirements of US customers.
10. Austria: $8.23 million (1.2%)
Lastly, Austria rounds out the top 10 countries that supply polypropylene to the US market. Austrian suppliers are renowned for their technical expertise and innovative solutions, offering US importers a diverse range of polypropylene materials to choose from.
Key Observations
-
Canada alone supplies more than half of all U.S. polypropylene imports.
-
Asian suppliers dominate the production of copolymers & specialty grades.
-
European suppliers focus on medical, food-grade, & high-consistency resins.
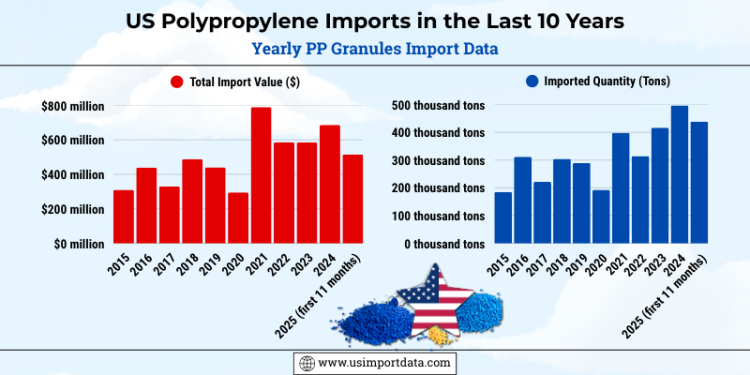
US Polypropylene Imports in the Last 10 Years: Yearly PP Granules Import Data
|
Year of Imports |
Total Import Value ($) |
Imported Quantity (Tons) |
|
2015 |
$309.58 million |
184.51 thousand tons |
|
2016 |
$439.13 million |
311.82 thousand tons |
|
2017 |
$329.52 million |
221.37 thousand tons |
|
2018 |
$488.06 million |
304.58 thousand tons |
|
2019 |
$440.54 million |
289.14 thousand tons |
|
2020 |
$294.67 million |
192.87 thousand tons |
|
2021 |
$789.27 million |
398.07 thousand tons |
|
2022 |
$585.37 million |
314.01 thousand tons |
|
2023 |
$584.55 million |
416.76 thousand tons |
|
2024 |
$686.93 million |
496.21 thousand tons |
|
2025 (first 11 months) |
$514.81 million |
$438.07 thousand tons |
USA Plastic Granules Buyers Database: Top Polypropylene Buyers Shipment Records
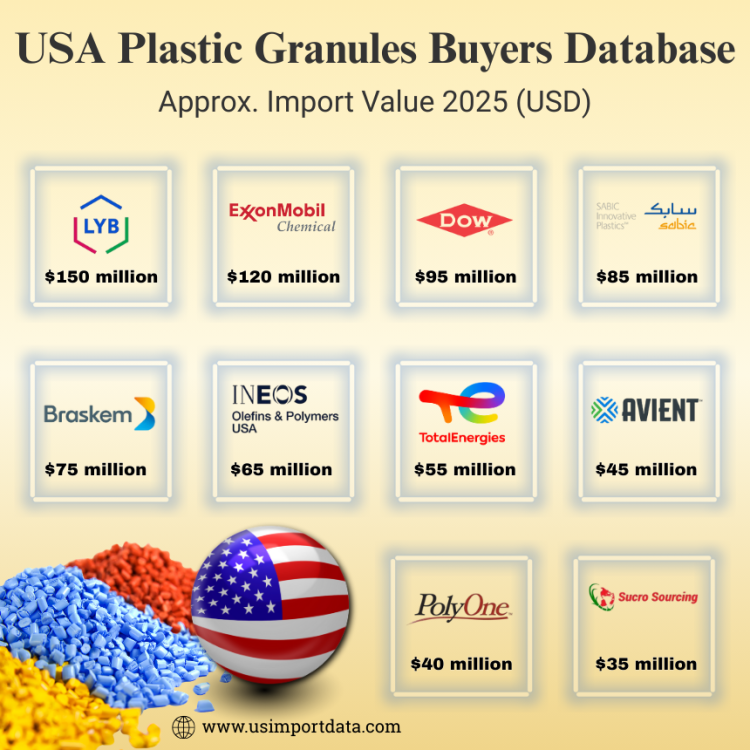
A plastic granules buyers database is not a list of random companies. It is built from actual import records and includes only companies that have proven purchasing history. The USA Plastic Granules Buyers Database offers valuable insights into the top Polypropylene buyers' shipment records, enabling industry professionals to make informed decisions based on detailed information. By utilizing this database, businesses can access essential data on Polypropylene importers, enabling strategic planning and fostering successful business partnerships. The leading plastic granules & polypropylene buyers in the USA, as per the US buyers & importers data for 2025, include:
|
Rank |
Company Name |
Approx. Import Value 2025 (USD) |
Top Import Types |
Top Import Sources |
|
1 |
LyondellBasell USA |
$150 million |
Homopolymer PP, Impact Copolymer PP |
Canada, Belgium |
|
2 |
ExxonMobil Chemical Company |
$120 million |
PP Homopolymer, Random Copolymer |
Canada, South Korea |
|
3 |
$95 million |
PP Copolymer, Specialty Grades |
South Korea, Germany |
|
|
4 |
SABIC Innovative Plastics US |
$85 million |
Injection-grade PP, Automotive PP |
Saudi Arabia, Netherlands |
|
5 |
Braskem America |
$75 million |
Raffia PP, Film-grade PP |
Brazil, Mexico |
|
6 |
INEOS Olefins & Polymers USA |
$65 million |
High-MFI PP, Industrial Grades |
Belgium, France |
|
7 |
TotalEnergies Petrochemicals USA |
$55 million |
PP Copolymers, Packaging Grades |
France, South Korea |
|
8 |
Avient Corporation |
$45 million |
Compounding PP, Filled PP Granules |
Germany, Italy |
|
9 |
PolyOne (now Avient legacy units) |
$40 million |
Modified PP, Color Masterbatch PP |
Germany, Japan |
|
10 |
SUCRO Can Sourcing / Regional Distributors |
$35 million |
Commodity PP Granules |
Canada, South Korea |
Typical Database Size (US – Polypropylene Only)
|
Metric |
Count |
|
Active Buyers |
700–800 |
|
Annual Import Shipments |
45,000+ |
|
Unique Suppliers |
3,500+ |
|
Data Fields per Buyer |
20–30 |
What Information Does a Buyers Database Have?
Global PP granules buyers and PP raffia granules buyers are actively seeking reliable suppliers, and access to accurate PP granules import data is crucial for understanding market dynamics. Traders often analyze polypropylene granules' HS code classifications to ensure proper documentation when they import plastic granules or when plastic granule importers assess international supply chains.
Polypropylene buyers across regions, including black PP granules buyers, also track related segments such as polypropylene scrap buyers to optimize cost and sustainability. In particular, Plastic granules buyers in USA represent a significant demand center for high-quality resins and compounds sourced from global producers. Each buyer profile typically includes:
-
Company name
-
Import location
-
HS code used (39021000)
-
Product description (Polypropylene)
-
Shipment volume per order
-
Port of entry
-
Country of origin
-
Import frequency
-
Decision-maker role (procurement/sourcing)
This allows exporters to sell smarter, not louder.

US Polypropylene Import Trends in 2025
Based on shipment activity and customs filings recorded through late 2024 and early 2025:
Volume Trend
-
Import volumes remain stable to slightly growing (2–4%)
-
Growth driven by:
-
Medical & healthcare plastics
-
Flexible packaging
-
Automotive lightweighting
Price Trend
|
Year |
Avg Import Price (USD/kg) |
|
2022 |
1.05 |
|
2023 |
0.93 |
|
2024 |
0.86 |
|
2025 (est.) |
0.80–0.90 |
Prices softened due to:
-
Improved global supply
-
Lower freight costs
-
Competitive pressure from regional producers
Who Imports Polypropylene in the US?
Importer Breakdown by Industry
|
Industry |
Share of Importers |
|
Plastic compounders & converters |
32% |
|
Packaging manufacturers |
24% |
|
Automotive component suppliers |
18% |
|
Medical & healthcare plastics |
11% |
|
Distributors & traders |
9% |
|
Others |
6% |
Import Frequency
-
High-volume buyers import monthly or quarterly
-
Medium buyers import 5–10 shipments/year
-
Small buyers import 1–3 shipments/year
USA Polypropylene Market Risks in 2026
Margin Pressure
-
Tight competition in commodity grades
-
Buyers negotiate aggressively on price
Compliance Requirements
-
Food-contact approvals
-
Medical-grade traceability
-
Sustainability documentation
Domestic Competition
-
U.S. producers reduce import dependence in standard grades
Strategic Opportunities
-
Specialty polypropylene grades
-
Medical and pharma packaging
-
High-impact automotive resins
-
Consistent small-lot suppliers
Future Outlook: 2026 and Beyond
While 2025 data suggests stable volumes and diversified sourcing under HS Code 39021000, several forces may alter future flows:
-
Domestic capacity expansions may reduce reliance on foreign polypropylene.
-
Sustainability trends could boost recycled PP imports or shift demand toward circular polymers.
-
Digital trade data adoption will sharpen buyer targeting.
Final Conclusion
The US polypropylene import market under HS Code 39021000 is a $580+ million annual market, importing over 415,000 metric tons of material every year. Even in 2025, imports remain essential despite strong domestic production. The US Polypropylene Import Report 2025 under HS Code 39021000 highlights a resilient and data-driven market shaped by diversified sourcing, steady demand, and evolving buyer expectations. For exporters and suppliers, success in this market depends on understanding import trends, identifying active buyers, and leveraging a structured plastic granules buyers database.
For exporters, success depends on:
-
Understanding real import data
-
Targeting verified buyers
-
Using a structured plastic granules buyers database
With Our US Polypropylene Buyers & Importers Database
-
Reach real companies in the US that are actually importing polypropylene
-
Explore buyers who regularly purchase in large volumes
-
Approach them at the right time, before they place their next order
-
Spot buyers who are changing suppliers and looking for better options
Result: 2–3× higher conversion rates.
Want to skyrocket your business with our database reports? Visit USImportdata and search live US polypropylene imports data by country. Contact us at info@tradeimex.in for customized trade reports, market insights, & a verified US polypropylene importers database, as per your requirements.
What's Your Reaction?