US Trade Balance 2024–25 | USA Trade Balance & Trade Deficit by Country
USA Balance of Trade shows a 1.2 trillion goods trade deficit in 2024-25. Explore US Trade Balance by Country & US Trade Deficit by Year.

In the ever-evolving landscape of international trade, understanding the intricacies of trade balance is crucial for policymakers, economists, and business leaders alike. The United States' goods trade deficit was $1.2 trillion in 2024, as per the US import data and US export data. Nations like the Netherlands and Hong Kong had surpluses, while China and Mexico had the biggest deficits. Compared to other significant partners, the US-Canada trade balance is comparatively balanced.
The United States had a trade surplus with 111 nations and a trade deficit with 92 countries in terms of goods trade in 2024. The United States is a key player in the global economy, with trade relationships with countries around the world. In this article, we will delve into the USA balance of trade for the years 2024-25 and explore the US trade balance by country.
Overview of US Trade Balance
The trade balance of a country is the difference between exports and imports of goods and services. A positive trade balance, also known as a trade surplus, occurs when exports exceed imports for the US trade balance goods and services. On the other hand, a negative trade balance, or trade deficit, occurs when imports surpass exports. The United States has experienced a trade deficit for many years, meaning that it imports more goods and services than it exports. This has been a subject of debate and concern, as some argue that a trade deficit can lead to job losses and a weakened domestic economy.
In 2024, the United States' balance of trade continued to show a deficit, with imports exceeding exports. The main contributors to the trade deficit were consumer goods, electronic products, and machinery. On the export side, the US maintained a strong presence in industries such as aerospace, pharmaceuticals, and agriculture.
US Trade Balance by Country: USA Balance of Trade with Top Trade Partners
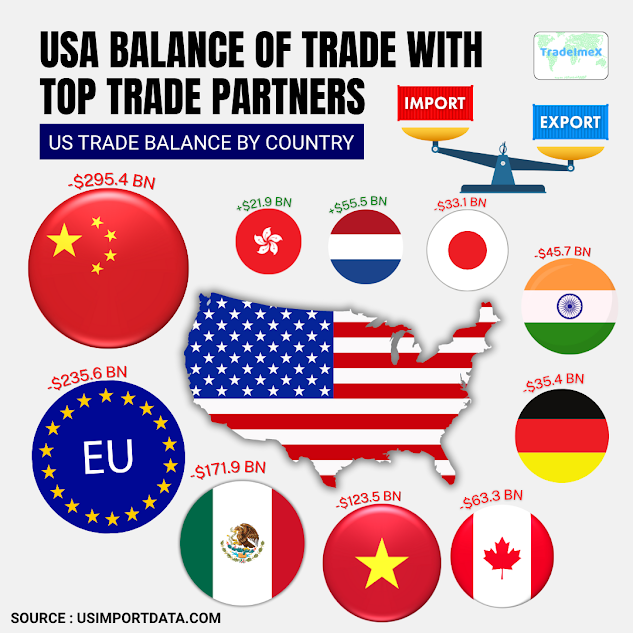
The US Trade Balance by Country provides critical insights into the economic relationships between the United States and its top trade partners. Analyzing the USA Balance of Trade with Top Trade Partners enables policymakers, businesses, and economists to understand the flow of goods and services between nations, highlighting areas of strength and potential challenges in trade relationships. By monitoring trade balances with key partners, such as China, Mexico, and Canada, decision-makers can make informed decisions to bolster economic growth and address trade imbalances. The top 10 countries from which the US had the most trade balance, as per the US trade balance by country and US trade data for 2024-25, include:
1. China: –$295.4 billion
China has long been the USA's largest trading partner, but the trade relationship has been marked by significant trade imbalances in recent years. With a trade deficit of $295.4 billion in 2024-25, the USA continues to import more goods from China than it exports, as per the data on US imports from China. This trade deficit has been a point of contention in US-China trade relations and continues to shape global economic dynamics.
2. European Union: –$235.6 billion
The European Union is another major trading partner of the USA, but the trade balance between the two entities also shows a significant deficit for the USA. In 2024-25, the USA had a trade deficit of $235.6 billion with the European Union, highlighting the imbalance in trade flows between the two regions. This trade deficit underscores the complexities of trade dynamics in a globalized economy.
3. Mexico: –$171.9 billion
Mexico is an important trade partner for the USA, particularly due to geographical proximity and the United States-Mexico-Canada Agreement (USMCA). However, the USA experienced a trade deficit of $171.9 billion with Mexico in 2024-25, indicating a significant reliance on Mexican imports. The trade balance with Mexico reflects the interconnected nature of trade relationships in the modern global economy.
4. Vietnam: –$123.5 billion
Vietnam has emerged as a key player in global trade, particularly in industries such as manufacturing and textiles. In 2024-25, the USA had a trade deficit of $123.5 billion with Vietnam, highlighting the growing economic ties between the two countries. The trade balance with Vietnam showcases the shifting dynamics of global trade patterns and the increasing importance of Southeast Asian economies.
5. Canada: –$63.3 billion
Canada is the USA's neighbor and closest ally, sharing a significant economic relationship through trade. However, the USA experienced a trade deficit of $63.3 billion with Canada in 2024-25, indicating a reliance on Canadian imports. The US trade balance with Canada underscores the intricacies of trade partnerships between neighboring countries and the impact of trade flows on the overall economy.
6. India: –$45.7 billion
India is a growing market with immense economic potential, attracting the attention of global investors and traders. In 2024-25, the USA had a trade deficit of $45.7 billion with India, reflecting the increasing trade ties between the two countries. The trade balance with India highlights the opportunities and challenges of engaging with emerging economies in a competitive global market.
7. Germany: –$35.4 billion
Germany is a powerhouse in the European Union and a key player in global trade, particularly in the manufacturing and technology sectors. In 2024-25, the USA had a trade deficit of $35.4 billion with Germany, indicating a significant flow of German exports to the USA. The trade balance with Germany showcases the interdependence of economies in a connected world and the impact of trade policies on economic outcomes.
8. Japan: –$33.1 billion
Japan is a technology and innovation leader with a strong presence in global trade networks. In 2024-25, the USA had a trade deficit of $33.1 billion with Japan, reflecting the import of Japanese goods and services. The trade balance with Japan demonstrates the complex trade relationships between advanced economies and the challenges of maintaining competitive advantages in a rapidly evolving economic landscape.
9. Netherlands: +$55.5 billion
The Netherlands stands out as a trade partner with a trade surplus with the USA, indicating a positive balance of trade for the USA. In 2024-25, the USA had a trade surplus of $55.5 billion with the Netherlands, highlighting the export opportunities and trade benefits between the two countries, as per the data on US exports to Netherlands. The trade balance with the Netherlands underscores the potential for mutually beneficial trade relationships and the importance of diversifying trade partners.
10. Hong Kong: +$21.9 billion
Hong Kong is a major financial hub and trading center in Asia, playing a critical role in global trade flows. In 2024-25, the USA had a trade surplus of $21.9 billion with Hong Kong, reflecting the strong economic ties and trade advantages between the two regions. The trade balance with Hong Kong illustrates the significance of strategic trade partnerships and the potential for economic growth through bilateral trade agreements.
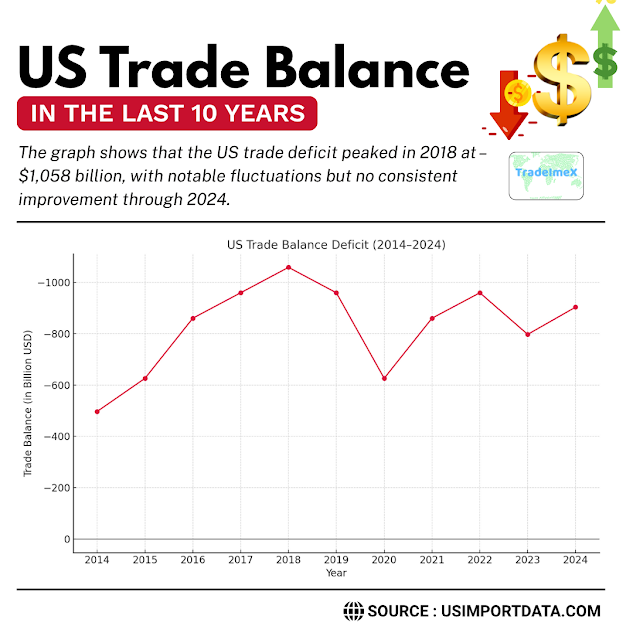
US Trade Balance in the Last 10 Years: A Decade of Persistent Deficits
From 2014 to 2024, the U.S. consistently ran trade deficits, reaching new depths in recent years. Here's how the goods and services gap evolved in the last 10 years, as per the Historical US trade balance, US trade deficit by year, and US trade data:
|
Year |
Trade Balance (Deficit) |
|
2014 |
–$497 billion |
|
2015 |
–$626 billion |
|
2016 |
–$860 billion |
|
2017 |
–$959 billion |
|
2018 |
–$1,058 billion |
|
2019 |
–$959 billion |
|
2020 |
–$626 billion |
|
2021 |
–$860 billion |
|
2022 |
–$959 billion |
|
2023 |
–$797 billion |
|
2024 |
–$903 billion |
Big Picture: US Trade Balance Timeline
Annual Overview: 2024 & Early 2025
-
2024: U.S. goods and services trade deficit reached $918 billion, up 24.7% from 2023, making it the second-largest ever, only behind 2022, as per the data on America trade balance.
-
The goods portion hit a record $1.2 trillion deficit, driven largely by imports.
-
May 2025: Deficit hit $71.5 billion monthly, an $11.3 billion jump from April, spurred by higher goods import gaps, as per America trade balance.
Monthly Goods Data:
-
2024 average negative monthly balance: around $100 billion; total goods deficit for the year: $1.205 trillion.
-
2025 Jan–May cumulative goods deficit: –$647 billion across $903 billion exports vs $1.55 trillion imports.
Drivers: Why Are These Imbalances So Large?
-
Strong U.S. Dollar & Domestic Demand: A strong dollar makes imports cheaper, fueling U.S. consumers’ appetite for foreign goods and deepening the deficit.
-
Global Supply Chains & Nearshoring Trends: Post-COVID shifts saw manufacturers move to Mexico, Vietnam, and India. While China’s deficit softened, others grew.
-
Resource Flows: Canada, traditionally a net resource exporter, still runs a deficit overall, but the surplus in non-resource goods underlines the complex trade mix.
-
Trade Policy & Tariffs: The U.S. has imposed tariffs on China, the EU, Canada, and Mexico. Though aimed at rebalancing, deficits have persisted. Non-China deficits often worsened.
Why These Deficits or US Trade Balance Matter: More Than Just Numbers
The Surge of Imports
From 2014 into 2024, U.S. import volume, especially goods, grew sharply, with consumer demand fueled by multibillion-dollar purchases of electronics, vehicles, machinery, and energy. A robust dollar further accelerated this intake, making foreign goods relatively cheaper.
Temporary Post-Pandemic Relief
In 2020, the goods and services deficit shrank to about –$626 B, largely due to pandemic-related declines in imports. But as 2021 ushered in economic reopening, the deficit rebounded strongly.
Supply Chain Realignment
Efforts to ‘nearshore’ production shifted patterns: deficits with China eased slightly while deficits with Mexico, Vietnam, and India grew, reflecting a diversified global manufacturing footprint.
2025 Trends & Mid-Year Snapshot
H1 2025 Trading Trends:
-
UNCTAD reports global trade rose by $300 billion in the first half of 2025, with a notable 14% jump in US imports.
-
Services contributed significantly, but the goods deficit remains the central issue.
Latest Snapshot – May 2025:
-
Monthly goods and services deficit: $71.5 B, with goods alone at $97.5 B; services surplus held at $26 billion.
-
Three‑month average goods & services deficit stands at $90 B/month.
-
YTD: goods & services deficit +50.4% versus YTD 2024.
Country-by-Country Deep Dive: 2024 Highlights
China
-
Goods deficit: $295 B, down from 2018’s $418 B peak.
-
Tariff policy slowed flows slightly, but dependency on Chinese goods remains high.
Mexico
-
Deficit: $172 B in 2024.
-
Manufacturing shift to Mexico (e.g., auto supply chains) enlarged trade volume.
Canada
-
Goods deficit: $63 B, offset by surplus in non-oil/gas categories.
-
Total bilateral might be less severe if non-resource sectors are excluded.
Vietnam
-
Vietnamese manufacturing is a lower-cost rival to China, producing electronics, apparel, and furniture.
European Union
-
EU bloc deficit: $236 B
-
Germany and Ireland highlighted Germany for autos, Ireland for pharmaceuticals.
Netherlands & UK
-
Netherlands surplus: +$55 B driven by oil & gas.
-
The UK also posted a modest surplus, powered by services and energy exports.
Implications & Outlook
Economic Pressure
-
Persistent deficits may weaken U.S. manufacturing, increase job competition, and drive inflation via supply imbalances.
-
Corporate seesaw: Imports help contain consumer prices; deficits discourage domestic investment long term.
Policy Moves
-
Tariff escalation (e.g., 30% EU tariffs looming, retaliatory EU services tariffs proposed).
-
Push for reshoring and industrial policy: USD-backed funding, U.S. defense/manufacturing revitalization plans are underway.
Global Trade Context
-
Despite global headwinds, the first half of 2025 saw trade values rise 2% in Q2, though volumes stayed flat, as per the global trade data.
-
Ongoing volcanic impacts: geopolitics, inflation, policy unpredictability cloud outlook.
Strategies to Reduce Deficits or Trade Balance
-
Diversify export sectors, particularly in manufacturing, energy, and digital services.
-
Negotiate targeted trade agreements to lower foreign barriers (e.g., EU pharma, China negotiation).
-
Invest in domestic competitiveness: infrastructure, workforce skills, and clean tech incentives.
-
Balance tariff use: ensure they don’t price out domestic exporters.
Final Takeaways
The U.S. trade balance for 2024–25 is prominently negative: $1.2 trillion goods deficit and $918 billion. Deficits are driven by:
-
Massive imbalances with China, Mexico, Vietnam, and the EU.
-
Persistent consumer demand is fueled by a strong dollar.
-
Shifting global manufacturing patterns.
However, services exports, domestic investment incentives, and emerging free‑trade frameworks offer paths to reduce imbalances. For 2025–26, the key indicators to watch, as per the US trade deficit by year are:
-
Monthly balance trends,
-
Bilateral negotiations (EU, China, Mexico),
-
Industrial policy efficacy (reshoring, subsidies),
-
Global economic headwinds and inflation dynamics.
Conclusion and Final Thoughts
In conclusion, exploring the USA balance of trade pr US trade balance by country for the years 2024-25 provides valuable insights into the dynamics of international trade. While the US continues to run a trade deficit overall, the trade relationships with key countries such as China, Canada, Mexico, the EU, and Japan are complex and multifaceted. Understanding these relationships is essential for policymakers and businesses looking to navigate the global marketplace effectively.
We hope that you liked our insightful and data-driven blog on the US trade balance by country for 2024-25. For more such US trade trends or to search live US trade data by country, visit USImportdata. Contact us at info@tradeimex.in for a customized US database report, as per your business needs.
What's Your Reaction?