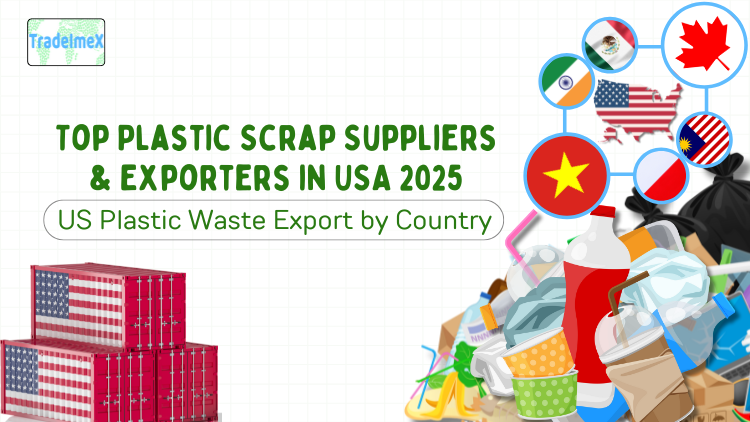
Top Plastic Scrap Suppliers & Exporters in USA 2025: US Plastic Waste Export by Country
Discover the top plastic scrap suppliers & exporters in the USA for 2025. Explore US plastic waste export data, top export destinations, & industry trends.
The United States remains one of the largest generators and exporters of plastic scrap in the world. While domestic recycling infrastructure continues to expand, international exports still play a key role in how America manages its plastic waste streams. The year 2024 marked another period of gradual transition, characterized by tighter global regulations, regional shifts in trade destinations, and an ongoing realignment of the plastic scrap market. According to the US export data and plastic scrap export data of the USA, the total value of US plastic scrap or plastic waste exports reached $264.30 million in 2024, a 6% increase from the previous year. According to the US plastic scrap export data, the US exported plastic scrap/waste worth $109.12 million in the first two quarters of 2025. Where does the US export plastic waste has long been a question for environmental researchers and policy makers. Recent reports reveal alarming plastic waste statistics US, showing that a significant portion of discarded plastics are shipped overseas for recycling or disposal.
The trend underlines growing concerns over transparency and environmental justice in US plastic waste statistics and the ecological burden such exports place on receiving countries. The USA is the 4th largest plastic scrap exporter in the world, as per the global trade data. This report offers a detailed look at the U.S. plastic scrap export landscape in 2024–25, focusing on the top exporters, destination countries, export volumes, and industry trends. It’s grounded in real trade data, providing a comprehensive view of where the U.S. plastic scrap industry stands as we move through 2025.
The State of U.S. Plastic Waste Exports in 2024–25
1. Export Volume and Growth Trends
In 2024, the United States exported roughly 900 million pounds of recovered plastic materials, equivalent to about 410,000 metric tons. This represented a modest decline of approximately 2% compared to 2023, continuing a multi-year trend of slow contraction.
While total volumes are slightly down, the composition of exports is shifting. Higher-value recyclable plastics such as PET (polyethylene terephthalate) bales recorded strong growth, while lower-grade mixed plastic exports declined due to tighter regulations and reduced demand from foreign recyclers.
Specifically:
-
PET scrap exports increased by about 24% year-on-year, reaching over 80,000 tons in 2024.
-
Mixed plastic scrap and off-grade resins fell by roughly 3–5%, reflecting declining global appetite for contaminated or hard-to-process materials.
-
The first half of 2024 saw exports stabilize at around 480 million pounds, nearly matching the same period in 2023.
Overall, export numbers show a leveling-off pattern: the market is neither collapsing nor rebounding dramatically, but instead reorganizing around cleaner, higher-quality scrap streams.
2. Major Destination Countries
The U.S. now exports plastic scrap to over 80 destinations, but the top five countries account for the bulk of trade volume. By mid-2025, the leading destinations for U.S. plastic waste were:
-
Canada – approximately 11 million kilograms per month
-
Mexico – around 6 to 7 million kilograms per month
-
India – roughly 2.7 million kilograms per month
-
Indonesia – about 2.8 million kilograms per month
-
Turkey – close to 1.2 million kilograms per month
Canada and Mexico together now account for over 45% of total U.S. plastic scrap exports. Their proximity, established trade routes, and inclusion in trade agreements such as USMCA make them ideal outlets for recovered materials.
Among Asian destinations, India and Indonesia have emerged as strong secondary markets, particularly for PET and HDPE scrap. These nations have growing recycling industries and have developed stronger controls for import quality in recent years. Turkey has also remained a significant hub, importing from both the U.S. and the European Union.
The dominance of neighboring countries reflects a structural shift, away from long-distance, low-value shipments and toward shorter, more regionally integrated trade flows.
3. Material Breakdown
Not all plastics are treated equally in global markets. Export demand varies sharply by polymer type and quality:
-
PET (Polyethylene Terephthalate): The standout performer. Export volumes rose about 24% in 2024. PET scrap, especially from beverage bottles, is in high demand for reprocessing into recycled PET (rPET) resin, which is used in packaging and textiles.
-
HDPE (High-Density Polyethylene): Stable exports, primarily in flake and bale form. Used in containers, films, and piping, HDPE maintains strong demand in India, Mexico, and Turkey.
-
LDPE/LLDPE (Low-Density Polyethylene): Gradual decline, mainly due to contamination and limited recyclability of flexible films.
-
PVC and mixed plastics: Continued decline, as many countries restrict imports of lower-grade and contaminated materials.
-
Off-grade and post-industrial scrap: Niche but steady. These materials are often sold through specialized exporters for industrial reuse.
This shift toward higher-quality, sorted plastics aligns with tightening global regulations and market preference for cleaner material streams.
4. Regional and Regulatory Context
The plastic waste trade has become one of the most closely monitored global environmental issues. Since the Basel Convention amendments in 2021, cross-border movements of non-hazardous plastic waste are allowed only under specific conditions. While the U.S. is not a party to the Basel Convention, it must comply with similar frameworks when trading with member countries.
Key regulatory trends shaping U.S. exports in 2024–25 include:
-
Increased import restrictions in countries such as Malaysia, Vietnam, and Thailand.
-
Improved domestic recycling infrastructure in the U.S., which reduces the need for export.
-
Enhanced transparency in reporting of export volumes and contamination levels.
-
Scrutiny of waste contamination, especially in exports from U.S. ports such as Los Angeles and Houston.
States like California, Oregon, and New York have also begun tracking waste exports more closely. California alone was estimated to export over 3 million kilograms of plastic scrap per month to Mexico in late 2024, but reports indicated that nearly half of that material was unrecyclable, prompting calls for reform.
Top Plastic Scrap Suppliers & Exporters in USA: US Plastic Waste Exporters Database
The US Plastic Waste Exporters Database is a valuable resource for businesses seeking reputable partners in the plastics industry. This database compiles a list of top suppliers and exporters, providing comprehensive information on their services and offerings. The plastic scrap suppliers in USA play a major role in the global recycling industry, providing quality materials to manufacturers and recyclers worldwide. Many plastic scrap exporters in USA focus on sustainable solutions, ensuring that the plastic waste export by country follows international regulations and environmental standards. Over the years, US export plastic waste volumes have fluctuated due to shifting global policies and recycling capacities.
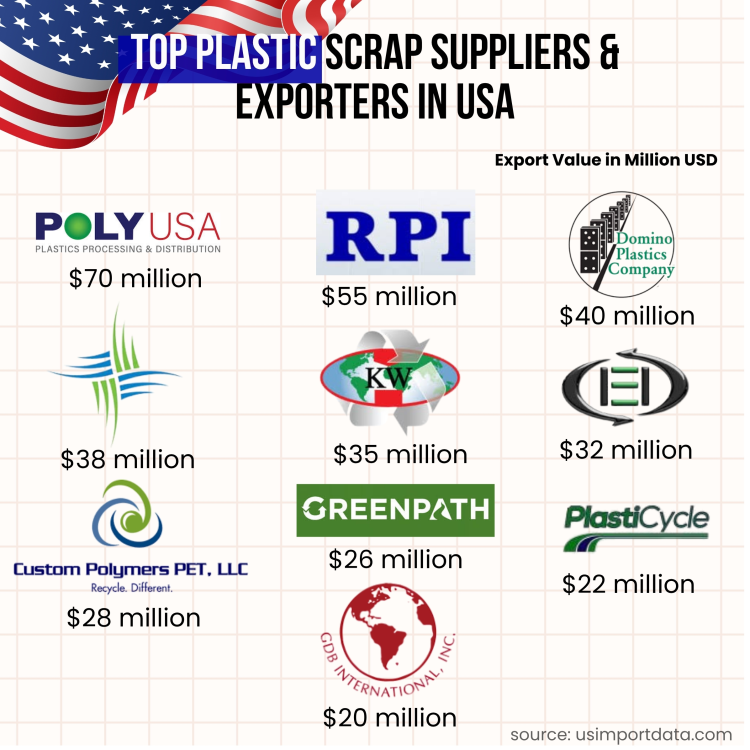
Despite challenges, US plastic waste exports continue to support circular economy initiatives across multiple regions. Reliable plastic scrap suppliers are essential partners in exporting plastic waste, promoting responsible waste management and resource recovery worldwide. The leading plastic scrap suppliers & exporters in the USA, as per the US plastic scrap exporters data and plastic waste suppliers list for 2024-25, include:
|
Rank |
Company Name |
Approx. 2024 Export Value (USD) |
Top Plastic Scrap Types |
Top Export Markets (2024–25) |
|
1 |
Poly USA Inc. (Houston, TX) |
$70 million |
PET, HDPE, LDPE, PP, off-grade resins |
India, China, Malaysia |
|
2 |
RPI Global (Houston, TX) |
$55 million |
Off-grade resins, HDPE, PP, film scrap |
India, Vietnam, Indonesia |
|
3 |
Domino Plastics Company Inc. (New York & Texas) |
$40 million |
Post-industrial PET, LDPE, and HDPE purges |
Canada, Mexico, South Korea |
|
4 |
Avangard Innovative Inc. (Houston, TX) |
$38 million |
LDPE film, LLDPE, recycled pellets |
Mexico, Canada, Colombia |
|
5 |
KW Plastics Recycling Division (Troy, AL) |
$35 million |
HDPE bottles, PP regrind, baled rigid plastics |
Mexico, Canada, Turkey |
|
6 |
Intercontinental Export-Import Inc. (Columbia, MD) |
$32 million |
PET, PP, engineering plastics, regrinds |
India, Malaysia, Thailand |
|
7 |
Custom Polymers Inc. (Charlotte, NC) |
$28 million |
PET, HDPE, engineering plastics |
Indonesia, Mexico, India |
|
8 |
Greenpath Enterprises Inc. (Ontario, CA) |
$26 million |
LDPE film, HDPE, PP scrap |
Mexico, Vietnam, Taiwan |
|
9 |
PlasRecycle LLC (Chicago, IL) |
$22 million |
LDPE film scrap, LLDPE pellets |
Canada, Malaysia, Indonesia |
|
10 |
GDB International Inc. (New Jersey) |
$20 million |
Mixed plastic scrap, PET flakes, PVC regrind |
India, Turkey |
US Plastic Waste Exports by Country: Where Does the US Export Plastic Scrap?
With an increasing emphasis on environmental sustainability and the need to reduce plastic pollution, many countries are looking for solutions to deal with the vast amounts of plastic waste generated each year. One common practice adopted by some countries is to export plastic scrap to other nations for recycling. The United States exports its plastic waste to various countries around the world as part of the global recycling supply chain.
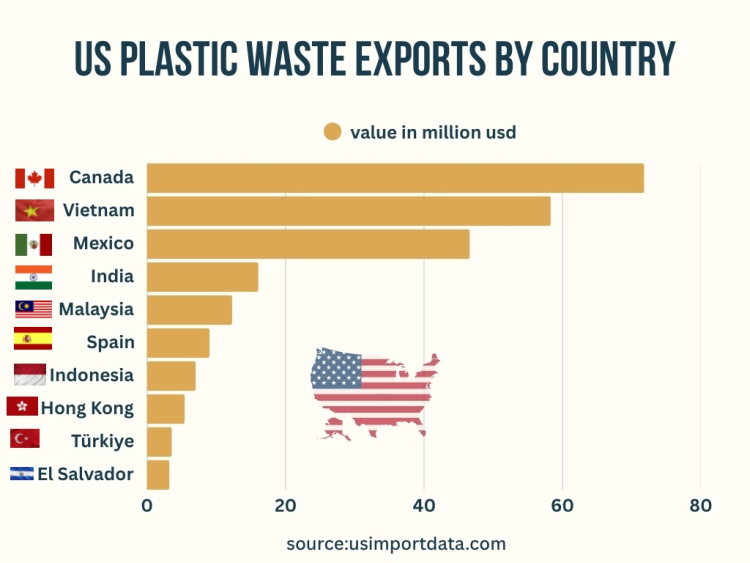
Some of the key destinations for US plastic scrap exports include countries like Canada, India, Hong Kong, Malaysia, and Mexico. These countries play a significant role in processing and recycling the plastic waste received from the US, contributing to the sustainability of the global plastics industry. The top 10 export destinations for US plastic waste, as per the data on US plastic waste export by country and US plastic scrap shipment data for 2024-25, include:
1. Canada: $71.80 million (27.2%)
Canada has emerged as the top destination for US plastic waste exports, with a significant proportion of plastic scrap being shipped to our northern neighbor. With a strong recycling infrastructure in place, Canada has the capacity to process and recycle the plastic waste imported from the US effectively.
2. Vietnam: $58.29 million (22.1%)
Vietnam has also become a major recipient of US plastic waste exports in recent years, with millions of dollars' worth of plastic scrap being shipped to the country annually, as per the data on US plastic scrap exports to Vietnam by HS code. Vietnam's growing economy and expanding recycling industry make it an attractive destination for US plastic waste.
3. Mexico: $46.61 million (17.6%)
Mexico is another significant importer of US plastic waste, with a considerable amount of plastic scrap being exported to the country. With a well-established recycling sector and a growing demand for recycled materials, Mexico provides a market for US plastic waste.
4. India: $16.08 million (6.1%)
India has seen a steady increase in US plastic waste exports in recent years, with millions of dollars' worth of plastic scrap being sent to the country for recycling. India's burgeoning recycling industry and large population create a demand for recycled plastic materials.
5. Malaysia: $12.29 million (4.7%)
Malaysia has become a prominent destination for US plastic waste exports, with a significant amount of plastic scrap being shipped to the country. Malaysia's strategic location and robust recycling infrastructure make it an ideal location for processing US plastic waste.
6. Spain: $9.03 million (3.4%)
Spain has also emerged as a key destination for US plastic waste exports, with a notable share of plastic scrap being sent to the country for recycling. Spain's advanced recycling facilities and commitment to sustainability make it an attractive option for US plastic waste.
7. Indonesia: $7.03 million (2.7%)
Indonesia has seen a growing influx of US plastic waste exports, with millions of dollars' worth of plastic scrap being shipped to the country, as per the data on US plastic scrap exports to Indonesia. Indonesia's developing recycling industry and increasing demand for recycled materials contribute to its popularity as a destination for US plastic waste.
8. Hong Kong: $5.42 million (2.1%)
Hong Kong serves as a crucial hub for US plastic waste exports, with a significant amount of plastic scrap passing through the region. Hong Kong's strategic location and efficient trade make it a favored transit point for shipping US plastic waste to other destinations.
9. Türkiye: $3.59 million (1.4%)
Turkey has also become a notable importer of US plastic waste, with millions of dollars' worth of plastic scrap being sent to the country. Turkey's growing recycling industry and demand for recycled materials make it an essential destination for US plastic waste exports.
10. El Salvador: $3.25 million (1.2%)
El Salvador rounds out the top ten destinations for US plastic waste exports, with a considerable share of plastic scrap being shipped to the country. El Salvador's efforts to strengthen its recycling sector and address plastic pollution make it a valuable partner for US plastic waste exports.
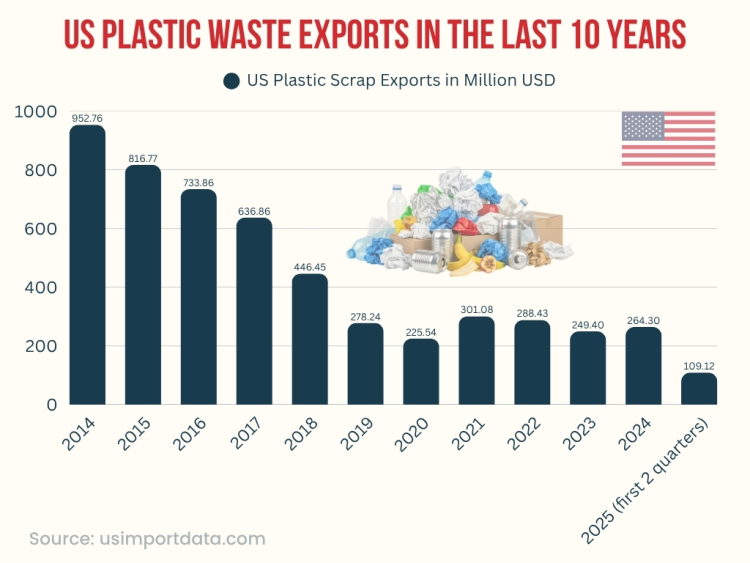
US Plastic Waste Exports in the Last 10 Years: Yearly US Plastic Scrap Export Data
|
Year of Exports |
Total Value of US Plastic Scrap Exports ($) |
|
2014 |
$952.76 million |
|
2015 |
$816.77 million |
|
2016 |
$733.86 million |
|
2017 |
$636.86 million |
|
2018 |
$446.45 million |
|
2019 |
$278.24 million |
|
2020 |
$225.54 million |
|
2021 |
$301.08 million |
|
2022 |
$288.43 million |
|
2023 |
$249.40 million |
|
2024 |
$264.30 million |
|
2025 (first 2 quarters) |
$109.12 million |
List of Top Plastic Scrap Suppliers in the U.S. (2025)
While thousands of companies trade in scrap plastics across the U.S., a relatively small number dominate exports. As of late 2024, trade databases listed nearly 2,000 U.S. plastic scrap suppliers exporting to more than 1,000 buyers worldwide. The following section profiles some of the most established and active exporters.
1. Poly USA, Inc. – Houston, Texas
Poly USA Inc. is widely recognized as one of the leading exporters of recyclable plastic materials in the United States. The company handles a wide spectrum of materials, including PET, HDPE, LDPE, and post-industrial scrap, and maintains long-term relationships with buyers in Asia, Europe, and Latin America.
Business model and strengths:
-
Direct partnerships with major resin manufacturers and compounders.
-
Robust trade infrastructure at the Houston Port enables efficient container exports.
-
Strong compliance and documentation systems that align with import requirements abroad.
-
Focus on high-purity, sorted plastic bales and off-grade resins.
Poly USA’s export operations illustrate the professionalization of the U.S. scrap market, where quality control, documentation, and customer reliability are crucial to maintaining overseas demand.
2. RPI Global – Houston, Texas
RPI Global operates as both a domestic collector and an international trading house. It focuses heavily on off-grade and post-industrial plastic materials, supplying clients across India, China, and Southeast Asia.
Key characteristics:
-
Specialization in off-specification resins and regrind plastics.
-
Consistent export volumes despite market fluctuations, thanks to niche sourcing strategies.
-
Expertise in mixed polymer streams and flexible film grades.
RPI Global demonstrates how diversified sourcing, including off-grade and by-product streams, can sustain export volumes even in a tightening regulatory environment.
3. Domino Plastics Company, Inc.
With over three decades of experience, Domino Plastics is a major buyer and seller of post-industrial plastic scrap across North America. The company has warehouses in multiple U.S. states and maintains trade relationships in Canada and Mexico.
Business model:
-
Buys directly from manufacturers and processors.
-
Offers trade and consolidation services for regional exports.
-
Trades in regrinds, purges, bales, and virgin off-grade resins.
Unlike companies focused solely on export, Domino integrates domestic and cross-border trade, serving as a bridge between local suppliers and international buyers.
4. Other Key Exporters and Trading Houses
Beyond these major players, several other U.S. firms remain active in global scrap trade:
-
Intercontinental Export-Import, Inc. – Focused on engineering and commodity plastics, exporting both reprocessed and virgin resins.
-
Avangard Innovative – A Houston-based sustainability company involved in recycling LDPE films and exporting processed pellets.
-
KW Plastics Recycling – The world’s largest plastics recycler, based in Alabama, which occasionally exports processed pellets to international buyers.
-
Indorama Ventures Recycling – Operates multiple facilities in the U.S. and contributes to PET recycling streams that may be traded internationally.
Together, these companies reflect the diversity of U.S. exporters, from specialized traders to vertically integrated recyclers with domestic reprocessing capacity.
US Plastic Scrap Export Patterns & Market Insights
1. Shift Toward Regional Trade
One of the clearest trends since 2022 has been the regionalization of U.S. plastic waste exports. With many Asian countries tightening import rules, North American neighbors have become the primary outlets for U.S. recyclables. Canada and Mexico alone account for nearly half of all export tonnage.
This trend reduces shipping costs, shortens trade timelines, and limits contamination issues. It also supports cross-border circularity, where materials can be reprocessed and potentially reimported as recycled resins or finished products.
2. The Rise of PET and Decline of Mixed Scrap
PET bales have become the cornerstone of U.S. export growth. As demand for recycled PET (rPET) surges globally, particularly in the beverage and textile sectors, clean PET scrap commands premium prices abroad. Mexico remains the largest single buyer, importing over half of the total U.S. PET scrap in 2024.
By contrast, mixed plastics and low-grade films are rapidly losing export viability. Many importers are no longer willing to accept loads with contamination rates above 5-10%. This trend is pushing U.S. suppliers toward better sorting, washing, and pelletizing before export, or toward domestic recycling alternatives.
3. Quality and Contamination Issues
Contamination remains the Achilles’ heel of U.S. plastic scrap exports. Reports from several states have shown that up to 30–50% of exported mixed bales may consist of non-recyclable materials such as PVC, laminates, or residues. These loads often end up incinerated or dumped in receiving countries, generating environmental backlash and tighter restrictions.
To counter this, top exporters have invested in:
-
Advanced sorting systems and infrared scanners.
-
Pre-export inspection and certification.
-
Buyer-specific quality control protocols.
These measures not only improve export credibility but also help sustain long-term partnerships with overseas recyclers.
Market Risks and Challenges
While the export market remains active, several headwinds are shaping the industry’s outlook for 2025:
-
Regulatory tightening – Both importing and exporting nations are raising standards for acceptable scrap quality.
-
Rising export costs – Higher freight and export rates affect the profitability of exporting low-value plastics.
-
Market saturation – Growing domestic recycling capacity in Mexico and India could gradually reduce import dependency.
-
Environmental scrutiny – NGOs and governments are increasingly monitoring U.S. waste exports for ethical and sustainability compliance.
-
Volatile resin prices – Recycled resin pricing fluctuates with oil markets, influencing export competitiveness.
Strategic Outlook for 2025
As of 2025, the U.S. plastic scrap export industry stands at a crossroads. The old model of mass exports of mixed, contaminated waste is fading. The new model prioritizes traceability, quality, and circular economy integration.
Key success factors going forward include:
-
Building supply chains around high-value polymers (PET, HDPE).
-
Establishing long-term contracts with regional buyers (Canada, Mexico).
-
Investing in preprocessing to produce cleaner, bale-ready materials.
-
Complying with documentation and environmental standards.
-
Leveraging digital tracking tools to verify waste origins and destinations.
Companies that embrace these shifts are likely to remain competitive in the global scrap trade, even as overall export volumes decline.
Summary: U.S. Plastic Scrap Export Landscape 2024–25
|
Category |
Detail |
|
Total export volume (2024) |
900 million pounds (410,000 tons) |
|
Change from 2023 |
-2% overall decline |
|
Fastest-growing export material |
PET bales (+24% YoY) |
|
Top destinations (2025) |
Canada, Mexico, India, Indonesia, Turkey |
|
Share of exports to non-OECD countries |
Around 30% |
|
Top U.S. exporters |
Poly USA Inc., RPI Global, Domino Plastics, Intercontinental Export-Import, Avangard Innovative |
|
Estimated number of U.S. scrap suppliers |
2,000 exporting to 1,000 buyers worldwide |
|
Main growth drivers |
PET demand, regional trade, and improved sorting technologies |
|
Main challenges |
Regulatory limits, contamination, & rising shipping costs |
Conclusion and Final Thoughts
The U.S. plastic scrap export market in 2025 is smaller but smarter. Instead of shipping huge quantities of unsorted waste, the focus has shifted to selective, value-driven exports of clean, recyclable polymers. North America has become the center of gravity for the U.S. scrap trade, with Mexico and Canada leading as primary buyers.
At the same time, exporters face new obligations: tighter compliance, improved traceability, and stronger environmental responsibility. The most successful players, such as Poly USA, RPI Global, and Domino Plastics, are those who have adapted early by building transparent supply chains and prioritizing quality over quantity.
As global plastic circularity gains momentum, 2025 will likely be remembered as the year the U.S. scrap export industry completed its transformation from a volume-based waste trade to a precision-driven recycling business model.
For more information on the latest US import-export data, or to search live data on US plastic waste exports by country, visit USImportdata. Contact us at info@tradeimex.in for customized trade reports, a verified database of the top plastic scrap suppliers & exporters in the USA, and market insights.
What's Your Reaction?