US-Kenya Trade Relations: Top US Exports to Kenya, Bilateral Trade Data, & Trade Agreement Insights
Explore US-Kenya relations with detailed data on the US–Kenya trade agreement, bilateral trade flows, US exports to Kenya, & Kenya exports to US.
Trade between the United States and Kenya has grown steadily over the past decade, driven by complementary economic interests, preferential trade measures, and deepening diplomatic ties. While Kenya remains a relatively small partner in global terms, its market is strategically important to U.S. exporters, investors, and geopolitics in East Africa. In 2024-25, trade flows expanded significantly, showing both opportunities and emerging challenges owing to changes in trade policy frameworks, particularly around the Africa Growth and Opportunity Act (AGOA). According to the latest US export data and Kenya import data, the total value of US exports to Kenya reached $782.52 million in 2024 and $930.8 million in the first 11 months of 2025, a massive increase from the previous years.
The total value of the US-Kenya trade accounted for $1.71 billion in the first 11 months of 2025, as per the US trade data & Kenya customs data. The USA is Kenya's 3rd largest trade partner, according to global trade data. In this article, we will break down the latest US-Kenya bilateral trade statistics, explore top U.S. export categories to Kenya, analyze Kenya’s export profile, and provide insight into trade agreements and negotiations shaping the future of US-Kenya trade.
Overview: US-Kenya Trade Relationship
U.S.-Kenya trade is built around two pillars:
1. Market access for goods and services; and
2. Investment and economic cooperation.
Recent Trade Levels
According to U.S. government data, total U.S. goods and services trade with Kenya reached approximately $3.3 billion in 2024, up about 18% over the prior year.
Breaking this down:
-
Goods trade (exports + imports): $1.5 billion.
-
U.S. goods exports to Kenya: $771.3 million (up 60.4% vs. 2023).
-
U.S. goods imports from Kenya: $737.1 million (up 5.8%).
-
Trade balance shifted to a U.S. surplus of ~$34.2 million in 2024, reversing a deficit in 2023.
-
Services trade: $1.8 billion.
-
U.S. services exports to Kenya: $781 million.
-
U.S. services imports from Kenya: $972 million.
-
This resulted in a U.S. services trade deficit of $192 million.
This combined picture underscores how trade in services, in sectors like travel, business services, and digital, is significant alongside merchandise trade.
Top Goods US Exports to Kenya: What Does the US Export to Kenya?
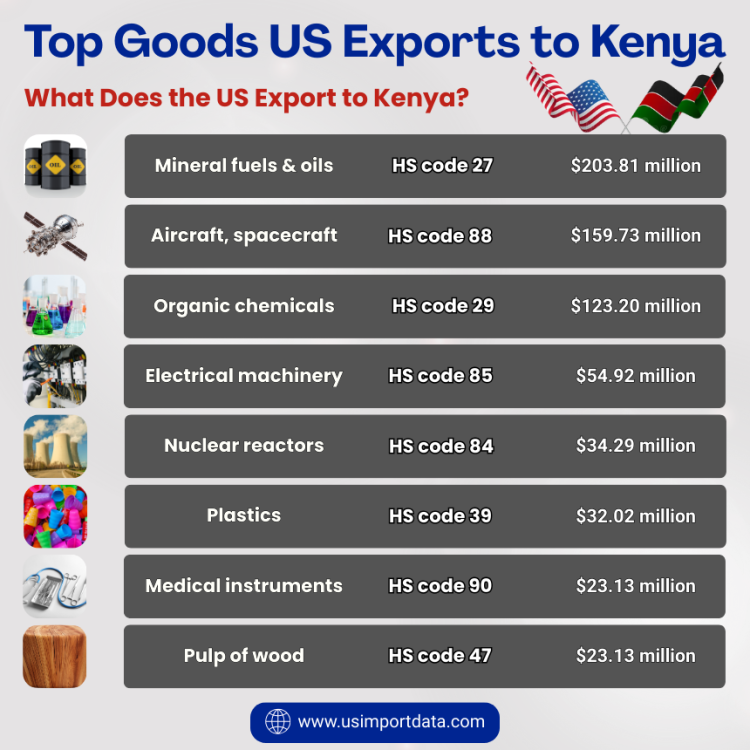
When it comes to the top goods the US exports to Kenya, several key products dominate the market. The US primarily exports machinery, vehicles, aircraft, and mineral fuels to Kenya. Machinery includes electrical machinery and equipment, vehicles consist of cars and trucks, while aircraft exports include airplanes and helicopters. Additionally, mineral fuels like petroleum oils play a significant role in US exports to Kenya.
These goods not only showcase the diverse range of products the US sends to Kenya but also highlight the strong trade relationship between the two countries. Trade composition matters as the nature of what the U.S. sells to Kenya reflects both economic complementarity and Kenyan development needs. The top 10 products that the US supplies to Kenya, as per the US shipment data for 2025, include:
1. Mineral Fuels & Oils (HS Code 27): $203.81 Million
Mineral fuels and oils are one of the top goods that the US exports to Kenya, with a total value of $203.81 million. These products are essential for various industries in Kenya, including transportation, manufacturing, and energy production. The US provides a reliable source of mineral fuels and oils, helping to meet Kenya's energy needs.
2. Aircraft, Spacecraft, & Parts Thereof (HS Code 88): $159.73 Million
Aircraft, spacecraft, and parts thereof are another significant export from the US to Kenya, totaling $159.73 million. These products play a vital role in supporting Kenya's aviation industry, facilitating travel and trade between the two countries. The high-quality aircraft and parts exported from the US help to maintain safety standards and efficiency in Kenya's airspace.
3. Organic Chemicals (HS Code 29): $123.20 Million
Organic chemicals are essential for a wide range of industries in Kenya, including pharmaceuticals, agriculture, and manufacturing. The US exports organic chemicals worth $123.20 million to Kenya, providing the necessary raw materials for various products. These chemicals contribute to the growth and diversification of Kenya's economy.
4. Electrical Machinery & Equipment (HS Code 85): $54.92 Million
Electrical machinery and equipment are crucial for the development of Kenya's infrastructure and technology sector. The US exports electrical machinery and equipment worth $54.92 million to Kenya, helping to improve access to modern technology and services. These products have a significant impact on the productivity and efficiency of various industries in Kenya.
5. Nuclear Reactors & Machinery (HS Code 84): $34.29 Million
Nuclear reactors and machinery exported from the US to Kenya are essential for the country's energy production and scientific research. With a total value of $34.29 million, these products contribute to the growth of Kenya's nuclear industry and the development of new technologies. The US exports high-quality nuclear reactors and machinery that meet international standards.
6. Plastics & Articles Thereof (HS Code 39): $32.02 Million
Plastics and articles thereof are widely used in various sectors in Kenya, including packaging, construction, and healthcare. The US exports plastics and articles worth $32.02 million to Kenya, providing essential materials for manufacturing and infrastructure projects. These products play a crucial role in supporting Kenya's economic growth and development.
7. Optical, Medical, & Surgical Instruments (HS Code 90): $23.13 Million
Optical, medical, and surgical instruments are vital for Kenya's healthcare sector, improving access to quality medical services and treatments. The US exports these instruments worth $23.13 million to Kenya, supporting the country's healthcare infrastructure and medical research. These high-quality instruments help to enhance healthcare delivery and patient outcomes in Kenya.
8. Pulp of Wood (HS Code 47): $23.13 Million
Pulp of wood is used in various industries in Kenya, such as paper production, packaging, and construction. The US exports pulp of wood worth $23.13 million to Kenya, providing essential raw materials for manufacturing and infrastructure projects. These products support the sustainability and growth of Kenya's forestry sector.
9. Animal or Vegetable Fats & Oils (HS Code 15): $12.04 Million
Animal or vegetable fats and oils are essential for food production and processing in Kenya. The US exports these fats and oils worth $12.04 million to Kenya, supporting the country's agricultural and food industry. These products contribute to the quality and diversity of food products in the Kenyan market.
10. Paper & Paperboard (HS Code 48): $11.07 Million
Paper and paperboard are essential for the packaging, printing, and publishing industries in Kenya. The US exports paper and paperboard worth $11.07 million to Kenya, supplying the necessary materials for various applications. These products play a crucial role in supporting Kenya's communication and education sectors.
These export categories show several important themes:
-
Energy and transport equipment are major U.S. exports, reflecting the needs of Kenya’s growing infrastructure and connectivity sectors.
-
Industrial and chemical products signal U.S. competitiveness in manufacturing inputs.
-
Technology and machinery exports help Kenyan firms upgrade production and services.
Together, these categories illustrate how U.S. exports support Kenya’s economic modernization while also tapping into rising demand from a youthful, urbanizing population.
Kenya’s Exports to the United States
Kenya’s export footprint in the U.S. market, though smaller than U.S. exports to Kenya, has expanded in key sectors, particularly those with a comparative advantage and under preferential trade access.
Top Kenyan Export Categories (2024)
According to trade data:
|
Product Category |
Export Value (2024) |
Notes |
|
Apparel (knit & non-knit) |
$386.7 million |
Largest U.S. import category from Kenya. |
|
Mineral fuels & oils |
$117.8 million |
Reflects some energy exports. |
|
Coffee, tea, spices |
$58.8 million |
Traditional agricultural exports. |
|
Edible fruits & nuts |
$24.2 million |
Horticulture products. |
|
Ores, slag & ash |
$16.9 million |
Mineral exports. |
|
Live plants/flowers |
$7 million |
Floriculture niche exports. |
|
Essential oils/cosmetics |
$5.5 million |
Specialty products. |
Kenya’s apparel exports alone, driven by textile and garment producers exporting under preferential access, accounted for a significant share of total exports to the United States in 2024. Other key agricultural products like coffee, tea, and fruits also found markets, though at smaller absolute values.
Apparel Sector and Jobs
The apparel sector has been a standout performer: one report records Kenya’s apparel exports to the U.S. under preferential tariff treatment at about $470 million in 2024, a roughly 19% increase over 2023 levels. Direct employment in apparel firms rose to 66,800 people, a significant source of jobs. These figures highlight both the economic and social importance of export-oriented manufacturing for Kenya’s labor market.
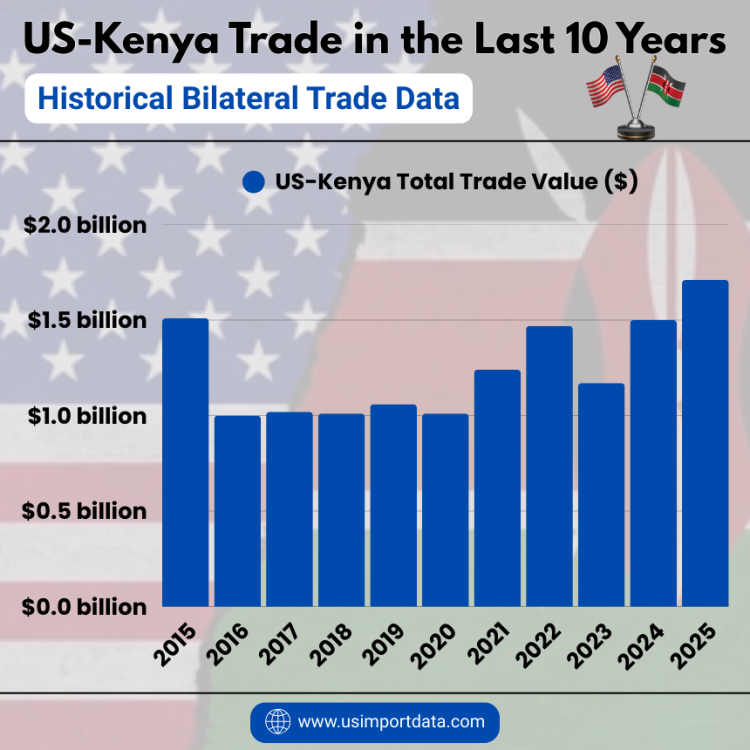
US-Kenya Trade in the Last 10 Years: Historical Bilateral Trade Data
|
Year of Trade |
US-Kenya Total Trade Value ($) |
|
2015 |
$1.51 billion |
|
2016 |
$1 billion |
|
2017 |
$1.02 billion |
|
2018 |
$1.01 billion |
|
2019 |
$1.06 billion |
|
2020 |
$1.01 billion |
|
2021 |
$1.24 billion |
|
2022 |
$1.47 billion |
|
2023 |
$1.17 billion |
|
2024 |
$1.50 billion |
|
2025 (first 11 months) |
$1.71 billion |
US-Kenya Bilateral Trade Trends
Growth in Trade Flows
From 2023 to 2024, U.S. exports to Kenya rose sharply, increasing more than 60% year-on-year, while imports from Kenya recorded modest growth. This dynamic flipped the merchandise trade balance in favor of the United States after a prior deficit.
Monthly U.S. export data shows that total goods exports to Kenya in 2024 totaled $771.3 million, while U.S. goods imports stood at $737.1 million. The 2024 annual trade balance closed with a slight U.S. surplus of $34.2 million.
Investment Links
Beyond goods and services, investment flows reinforce commercial ties. U.S. foreign direct investment in Kenya was reported at approximately $163 million in 2024, reflecting capital flows that go beyond cross-border trade into long-term engagement in sectors such as energy, technology, and manufacturing.
Trade Agreements Shaping the Relationship
Trade policy frameworks govern how goods move between the U.S. and Kenya. These agreements influence tariffs, market access, and investor confidence.
African Growth and Opportunity Act (AGOA)
For over two decades, the African Growth and Opportunity Act (AGOA) has been the centerpiece of U.S. trade preference policy for sub-Saharan Africa. It has provided eligible countries, including Kenya, with duty-free access to the U.S. market for thousands of products, especially garments, textiles, and agro-processed goods. The AGOA expired on September 30, 2025.
AGOA’s Economic Impact
-
AGOA boosted Kenya’s exports, notably apparel, and supported job creation in export sectors.
-
Duty-free access under AGOA helped Kenyan textiles enter U.S. markets at competitive prices, underpinning export growth.
AGOA Uncertainty and Expiry
However, AGOA expired in 2025, after years of negotiations and attempts to renew it. The expiration abruptly ended duty-free access for Kenya and other eligible countries, potentially exposing exports to higher tariffs.
Kenyan producers and trade experts have warned that the loss of AGOA preferences could make apparel and other exports less competitive in the U.S. market unless a new framework is agreed upon.
TIFA and Regional Agreements
Beyond AGOA, the U.S. and Kenya engage under regional trade frameworks:
-
The Trade and Investment Framework Agreement (TIFA) with the East African Community (EAC) was signed in 2008.
-
TIFA with the Common Market for Eastern and Southern Africa (COMESA) dating from 2001.
-
These frameworks cover trade cooperation, investment, and regulatory dialogue, though they do not provide the same tariff benefits as AGOA.
Future Trade Negotiations
With AGOA’s expiration, discussions continue on new bilateral trade arrangements that could replace or improve upon past preferences. Both governments have signaled interest in negotiating agreements that support reciprocity, protect jobs, and sustain market access:
-
Kenyan officials publicly emphasize building a more balanced trade framework that can support industrial growth and local job creation.
-
U.S. policymakers have shown interest in bilateral deals that go beyond unilateral preferences, potentially focusing on rules-based trade, investment protections, and standards alignment.
The outcome of these negotiations will shape the next phase of US-Kenya economic relations and could redefine how trade competitiveness and market access are structured in a post-AGOA era.
What the Data Tells Us About the Business Environment
The bilateral trade data reflects several broader structural points:
Diversification of Trade
Kenya’s export portfolio to the U.S. is concentrated in apparel, agriculture, and niche horticultural products. There is potential to diversify into higher-value segments like processed foods, organic products, and specialized manufacturing, particularly if trade barriers are reduced and supply chains strengthened.
Services and Investment as Growth Engines
Services trade and foreign direct investment are growth levers that complement goods trade. Kenya’s expanding tech, financial services, and travel sectors provide potential export growth in non-goods categories, while U.S. direct investment contributes to capacity building.
Policy Stability Matters
The expiration of AGOA underscores the importance of predictable, long-term policy frameworks. Businesses, both Kenyan exporters and U.S. investors, benefit from stable trade rules that reduce uncertainty and support planning.
Challenges and Opportunities Ahead
Challenges
-
Tariff Barriers Post-AGOA: Many Kenyan exports face higher tariffs now that AGOA preferences have lapsed, which could dampen export competitiveness unless new terms are negotiated.
-
Non-Tariff Barriers: Complex customs procedures, regulatory differences, and logistical bottlenecks can raise costs for exporters on both sides.
-
Trade Imbalances: While Kenya has seen export growth, it still runs trade deficits with the U.S. in some sectors, notably services, and structural imbalances persist.
Opportunities
-
New Trade Frameworks: Negotiating a modern bilateral trade agreement could institutionalize reciprocal market access and reduce barriers.
-
Value Chain Integration: Kenya’s integration into global value chains, particularly in textiles, agriculture, and digital services, could expand with investment and infrastructure improvements.
-
Private Sector Engagement: Both countries can leverage public-private partnerships to deepen linkages in sectors such as renewable energy, digital services, and agribusiness.
Conclusion and Final Thoughts
The U.S.-Kenya trade relationship is evolving. Recent data from 2024-25 shows that trade flows are expanding, with U.S. exports to Kenya growing robustly and Kenyan exports, especially apparel, becoming more significant in the U.S. market. Trade policies like AGOA have played a major role in shaping this dynamic. With AGOA’s expiry, both countries are at a crossroads: either negotiate a new trade framework that preserves and expands market access or face reduced competitiveness & uncertainty.
For businesses, investors, and policymakers, the focus now is on turning challenges into opportunities, leveraging private investment, negotiating clear and reciprocal trade rules, and building resilient, diversified trade ties that reflect the broader U.S.-Kenya economic partnership.
For more information on the latest US import-export data, or to search live data on US exports by country, visit USImportdata. Contact us at info@tradeimex.in for customized trade reports and market insights.
What's Your Reaction?