Top Palm Oil Buyers & Importers in USA | US Palm Oil Imports by Country
US Palm Oil Imports by Country reached $1.88 billion in 2024, a 7% decline from 2023. Discover top Palm Oil Buyers and Importers in USA and explore 2025 import trends.
The United States has been a significant player in the global palm oil market, with a high demand for this versatile vegetable oil. Palm oil is a widely used vegetable oil that is found in a vast array of consumer products, ranging from food items to personal care products and biofuels. Its versatility and cost-effectiveness have made it a staple in various industries, driving the demand for palm oil on a global scale. According to the US import data and USA palm oil import data, the total value of US palm oil imports reached $1.88 billion in 2024, a 7% decline from the previous year. In 2025, the United States continues to be a significant importer of palm oil, just behind powerhouse markets like India and China.
In 2024, the U.S. imported nearly 1.8 million metric tons of palm oil, valued at $1.88 billion, making it the fourth-largest palm oil importer globally. Nearly 98% of these imports were refined palm oil, with Indonesia supplying roughly 85% of the total volume, while Malaysia accounted for more than 10%. The US imported palm oil at a total quantity of 1.74 million metric tons in 2024-25. As per the US import statistics, the US imports of palm oil accounted for $547.39 million in the first quarter of 2025. The US is the 4th largest palm oil importer in the world, as per the global trade data. In this article, we will delve into the US palm oil imports data for the year 2025, highlighting the top US palm oil importers and palm oil imports by country.
US Palm Oil Imports by Country: Where Does the US Import Palm Oil From?
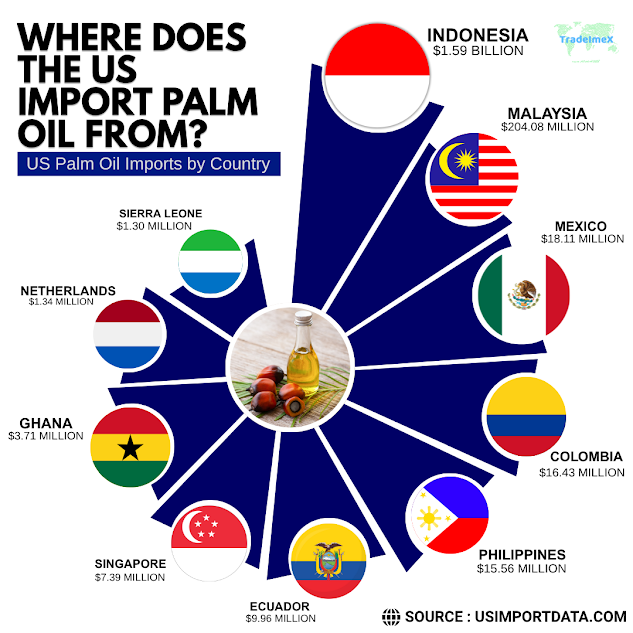
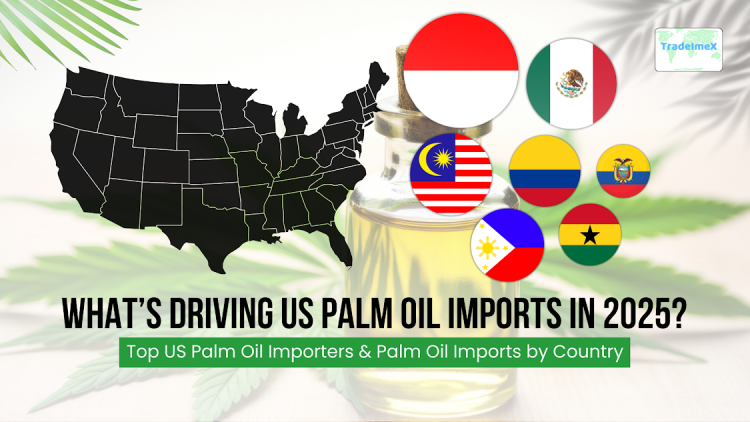
US Palm Oil Imports by Country play a significant role in the global market, with the United States importing the majority of its palm oil from countries such as Indonesia and Malaysia. These nations are the top producers of palm oil and supply a substantial amount to meet the demand in the US. The top 10 import partners for US palm oil, or the major countries from where the US imports palm oil, as per the US shipment data and US palm oil imports by country, in 2024-25, include:
1. Indonesia: $1.59 billion (84.9%)
Indonesia is the leading supplier of palm oil to the United States, accounting for a whopping 84.9% of total US palm oil imports, as per the data on US palm oil imports from Indonesia. The country's tropical climate and fertile soil make it an ideal location for palm oil production, leading to high-quality and cost-effective products that are in high demand in the US market.
2. Malaysia: $204.08 million (10.9%)
Following Indonesia, Malaysia is the second-largest supplier of palm oil to the US, with a market share of 10.9%, as per the data on US palm oil imports from Malaysia by HS code. Malaysian palm oil is known for its superior quality and is widely used in a variety of products, ranging from cooking oil to personal care items.
3. Mexico: $18.11 million (1%)
Mexico also plays a significant role in supplying palm oil to the US, accounting for 1% of total imports, as per the data on US palm oil imports from Mexico. The proximity of Mexico to the US makes it a convenient source of palm oil for American consumers and manufacturers.
4. Colombia: $16.43 million (0.9%)
Colombia is another key player in the US palm oil market, with a market share of 0.9%, as per the data on US palm oil imports from Colombia. Colombian palm oil is valued for its sustainability practices and environmentally friendly production methods, making it an attractive option for eco-conscious consumers.
5. Philippines: $15.56 million (0.8%)
The Philippines is a relatively small but important supplier of palm oil to the US, with a market share of 0.8%. Philippine palm oil is known for its unique flavor profile and is often used in specialty food products.
6. Ecuador: $9.96 million (0.5%)
Ecuador may not be a major player in the US palm oil market, but it still holds a significant share of 0.5%. Ecuadorian palm oil is prized for its high quality and is used in a variety of culinary applications.
7. Singapore: $7.39 million (0.4%)
Singapore may be a small city-state, but it plays a role in supplying palm oil to the US, accounting for 0.4% of total imports. Singaporean palm oil is known for its versatility and is used in a wide range of products.
8. Ghana: $3.71 million (0.2%)
Ghana is a relatively minor player in the US palm oil market, with a market share of 0.2%. However, Ghanaian palm oil is valued for its sustainable production practices and is increasingly sought after by environmentally conscious consumers.
9. Netherlands: $1.34 million (0.1%)
The Netherlands may seem like an unlikely source of palm oil, but it still contributes to the US market with a share of 0.1%. Dutch palm oil is known for its high quality and is often used in premium food products.
10. Sierra Leone: $1.30 million (0.1%)
Finally, Sierra Leone rounds out the top 10 countries from which the US imports palm oil, with a market share of 0.1%. Sierra Leonean palm oil is prized for its small-scale, community-based production methods, making it a unique and socially responsible choice for consumers.
List of Top Palm Oil Importers in the US: USA Palm Oil Importers Database
The US Palm Oil Importers Database serves as a valuable resource for businesses looking to connect with leading palm oil importers in the United States. This meticulously curated database offers detailed insights and shipment data information for key players in the palm oil import industry, enabling US companies to forge beneficial partnerships and streamline their supply chains. The leading palm oil importers in the US, as per the US palm oil importers data and the US buyers list for 2024-25, include:
|
Rank |
Company Name |
Approx. Import Value (2024) |
Top Import Sources |
|
1 |
Cargill |
$350 million |
Indonesia, Malaysia |
|
2 |
Wilmar International |
$280 million |
Indonesia, Malaysia |
|
3 |
IOI Group |
$200 million |
Malaysia, Indonesia |
|
4 |
Musim Mas |
$180 million |
Indonesia |
|
5 |
Golden Agri-Resources |
$150 million |
Indonesia |
|
6 |
Sime Darby Plantation |
$130 million |
Malaysia |
|
7 |
Bunge Limited |
$120 million |
Indonesia |
|
8 |
Louis Dreyfus Company |
$110 million |
Indonesia, Malaysia |
|
9 |
ADM (Archer Daniels) |
$100 million |
Indonesia |
|
10 |
Sinar Mas Group |
$90 million |
Indonesia |
Insights
1. Market concentration among giants
The top 10 US palm oil import companies, including Cargill, Wilmar, ADM, and Bunge, orchestrate the lion’s share of U.S. palm oil imports. These agribusiness giants wield significant influence over pricing and supply-chain decisions.
2. Indonesia dominates the supply
In 2024, Indonesia supplied 87–90% of U.S. palm oil imports (1.6 million tons, $1.6 billion), with Malaysia contributing around 9–10% ($170 million). Other countries collectively account for under 5%.
3. Value trends reflect volume shifts
Total U.S. palm oil import value dropped to approximately $1.8 billion in 2024, down from 2023’s peak ($2 billion) and far below the 2022 high of $2.3 billion.
4. Sustainability and transparency are strategic drivers
Importers like Wilmar, IOI, and Musim Mas have invested heavily in RSPO certification and “No Deforestation, No Peat, No Exploitation” (NDPE) commitments to address consumer and retailer pressure.
5. Trade tensions may reshape sourcing
Indonesia is considering retaliatory tariffs on U.S. imports, which may shrink its U.S. shipments by 15–20%, potentially elevating Malaysia’s share.
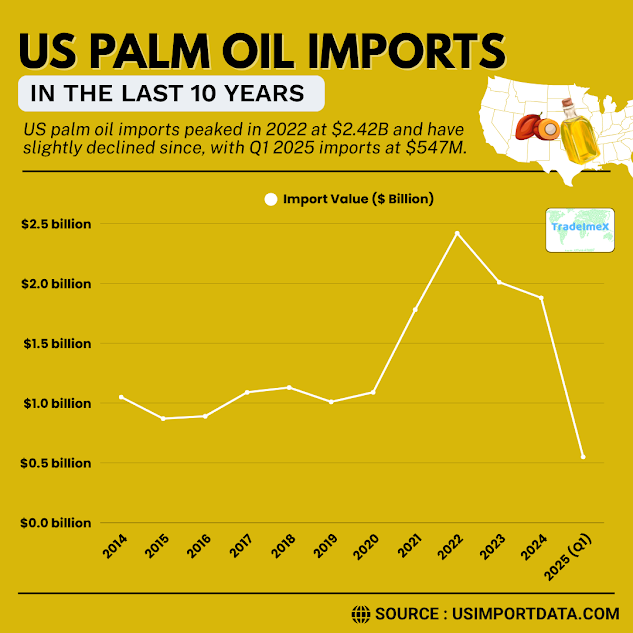
US Palm Oil Imports in the Last 10 Years: Historical US Palm Oil Import Data
|
Year of Imports |
US Palm Oil Import Value ($) |
|
2014 |
$1.05 billion |
|
2015 |
$866.26 million |
|
2016 |
$891.90 million |
|
2017 |
$1.09 billion |
|
2018 |
$1.13 billion |
|
2019 |
$1.01 billion |
|
2020 |
$1.09 billion |
|
2021 |
$1.78 billion |
|
2022 |
$2.42 billion |
|
2023 |
$2.01 billion |
|
2024 |
$1.88 billion |
|
2025 quarter 1 |
$547.39 million |
Key Factors Behind the US Palm Oil Import Growth in 2025
In recent years, the demand for palm oil in the United States has been steadily increasing. But what exactly is driving this surge in palm oil imports in 2025? Let's take a closer look at the key factors influencing the growth of the US palm oil market.
1. Increasing Use of Palm Oil in the Food Industry
One of the primary drivers of US palm oil imports is the growing use of palm oil in the food industry. Palm oil is a versatile and cost-effective ingredient that is commonly used in a wide range of food products, including baked goods, snacks, and processed foods. With consumers increasingly seeking out products that contain natural ingredients, many food manufacturers are turning to palm oil as a sustainable alternative to other oils.
2. Rising Demand for Biofuels
In addition to its use in the food industry, palm oil is also in high demand for the production of biofuels. As the US government continues to push for greater adoption of renewable energy sources, the demand for biofuels derived from palm oil is expected to increase. This is driving up palm oil imports as US companies look to meet the growing demand for biofuels.
3. Environmental Concerns and Sustainable Sourcing
However, the increase in US palm oil imports has also come under scrutiny due to concerns about deforestation and the impact of palm oil production on the environment. In response to these concerns, many US companies are now committed to sourcing sustainable palm oil that is certified by organizations such as the Roundtable on Sustainable Palm Oil (RSPO).
U.S. Palm Oil Imports 2024–25: The Numbers
Volume & Value Trends
-
2024 volumes: 1.8 million metric tons (slightly down from 1.9 million in 2023; −4.1%).
-
Value of imports: $1.77 billion in 2024; ranked #255 out of all U.S. import categories
-
Supplier breakdown (2024):
-
Indonesia: 1.6 Mt (90%); valued at $1.6 billion
-
Malaysia: 154 kt (9.6%); $170 million
US Palm Oil Import Composition: Refined vs. Crude
-
Refined palm oil: 1.7 Mt (98% of imports); average price $1,009/ton
-
Crude palm oil: 27 kt (1.5%) priced at $102/ton.
The sharp tilt toward refined products reflects U.S. food manufacturing needs, clean labels, stability, and convenience.
Price Dynamics
-
Average import price dropped slightly to $995/ton in 2024 (−3.6% from 2023), though still elevated compared to early 2021.
-
Malaysia fetched slightly higher prices ($1,102/ton) than Indonesia ($979/ton), likely due to quality and trade factors.
Why These US Palm Oil Import Trends are Emerging
Price & Substitution Effects
Global palm oil prices have softened since the mid‑2022 export bans by Indonesia/Malaysia, leading to a drop from $1,362/ton to $995/ton. That price gap encouraged U.S. buyers to shift from other vegetable oils, especially as soybean oil and sunflower oil remained stable or high.
However, the U.S. soybean oil market has recently soared in exports, buoyed by increased demand and lower palm prices, leading to more U.S. soy going abroad and fueling domestic palm oil consumption.
Industrial Demand – Food & Consumer Goods
Palm oil’s functional benefits, solid at room temperature, and stability make it irreplaceable in:
-
Commercial baking (margarines, shortenings, confections)
-
Processed foods (snacks, ready meals)
-
Personal care (soaps, shampoos, balms: nearly 70% of global beauty/cleaning products employ palm derivatives)
Disrupting this supply chain costs more than raw ingredient price savings, so demand remains sticky.
Biofuels & Renewable Diesel Interplay
While U.S. renewable diesel mainly taps soybean oil, palm oil prices still influence energy choices. High palm prices can tilt feedstock selection:
With palm oil priced above soybean oil until mid‑April, U.S. soybean oil exports increased, especially to India, and soybean oil use for biodiesel dipped.
This dynamic suggests that palm oil indirectly shapes U.S. biofuel economics, dampening or shifting soybean oil demand.
Indonesia vs. Malaysia: Supply-Side Pressure to the US
Indonesia’s Dominance & Risks
-
Indonesia produced 46 Mt of palm oil in 2024–25, down 0.5 Mt due to weather and floods.
-
Indonesia accounts for 85% of U.S. palm imports, averaging 2.25 Mt annually. Although Indonesia’s palm oil exports to the US may decline due to tariffs.
-
Tariff threat: A proposed 32% retaliatory tariff on Indonesian goods could reduce U.S. imports by 15–20%.
-
In response, Indonesia plans to negotiate in Washington, while U.S. food processors look for alternatives.
Malaysia: Small Player, Potential Beneficiary
-
Malaysia supplied 10% of U.S. palm oil imports (154 kt), with a higher price and a small but strategic margin.
-
If Indonesian supplies face tariffs, Malaysia could fill in, offering a refined, tariff-advantaged alternative.
-
But limited production capacity and a focus on value-added palm derivatives constrain its scaling potential.
Policy, Economics & Trade Instruments
Tariffs & Trade Policy
-
A looming 32% tariff on Indonesian palm could realign market shares.
-
Meanwhile, the existing 10% base tariff on palm oil helps protect local interests, cushioning price volatility.
Sustainability & ESG Pressure
Though not strictly enforced, sustainability is gaining ground:
-
U.S. manufacturers are under growing regulatory and consumer pressure to source RSPO-certified palm oil.
-
Progress remains limited, but expect gradual shifts driven by corporate sustainability goals and importer due diligence laws.
2025 Outlook for US Palm Oil Imports: Strategic Scenarios
Scenario A: Tariff Imposition on Indonesia
-
Win for Malaysia: Gains modest U.S. market share; higher prices constrain food manufacturers.
-
Disrupted supply chains: U.S. processors scramble to adjust blends or turn to local soybean-based alternatives.
-
Consumer impact: Short-term price pass-through risks exist, though mitigated by alternate oils and inventory buffers.
Scenario B: No Tariff / Trade Deal
-
U.S. continues deep reliance on Indonesia (85–90%) with modest growth.
-
Malaysia remains niche (10%) due to capacity limits.
-
Import volumes stay near 1.8–1.9 Mt; prices hover near $1,000/ton.
Scenario C: ESG-Driven Shift
-
Improved sustainability audits and sourcing might drive U.S. corporate buyers toward certified Malaysian refined oil, even at a premium.
-
Indonesia may invest in traceability and deforestation-free certification, but effectiveness remains uncertain.
Scenario D: Feedstock Competition
-
If soybean oil prices fall (due to record U.S. soybean plantings), and renewable diesel demand spikes, palm could lose traction.
-
Conversely, disruptions in soy supply (drought, export limits) may bolster palm demand, but U.S. processors are slower to pivot away from soy.
Final Takeaways
|
Theme |
Insights |
|
Volume & Value |
U.S. imported 1.8 Mt (–4% YoY) valued at $1.88 billion in 2024. Refined products dominate. |
|
Supply Reliance |
Indonesia: 90% share; Malaysia: 10%. Tariff risk is key. |
|
Main Drivers |
Price gaps, food & industrial uses, biofuel interplay, policy shifts. |
|
Trade Policy Watch |
A 32% Indonesian tariff looms; timing and terms matter. |
|
Looking Ahead |
Supply uncertainty, sustainability trends, and crop competition will shape 2025 outcomes. |
Broader Context
-
Global supply tightness: 2024–25 production dipped (78.2 Mt globally) due to weather setbacks in Southeast Asia.
-
Market substitution: India reaffirmed this, trading down from palm to cheaper sunflower/soybean oils.
-
Biofuel divergence: U.S. soybean oil remains primary feedstock; palm oil influence is indirect, via price spreads.
Recommendations for Stakeholders
-
Food processors: Hedge supply risks, diversify procurement (Malaysia, RSPO-certified suppliers).
-
Traders/importers: Monitor U.S.–Indonesia negotiations; favor Malaysian refined stockpiles.
-
Policy advocates: Track tariff developments and emerging sustainability regulations.
-
Investors: Global palm commodity prices and currency moves (IDR, MYR) remain key risk indicators.
Conclusion and Closing Thoughts
In conclusion, the driving force behind US palm oil imports in 2025 is multifaceted, with factors such as the increasing use of palm oil in the food industry, the rising demand for biofuels, and concerns about sustainability all playing a role. U.S. palm oil imports continue to reflect global forces, price dynamics, trade relations, downstream industrial demand, and evolving sustainability standards. As the U.S. navigates a future marked by potential Indonesian tariffs and innovative biofuel competition, market participants must stay agile and data-driven.
2025 isn’t just a transitional year; it will set the tone for long-term sourcing strategies amid geopolitical shifts, regulatory reforms, and changing consumer preferences. Stakeholders ready to adapt will find sustainable value; those stuck in traditional supply chains may face increasing volatility.
We hope that you liked our insightful and data-driven interactive blog report on US palm oil imports in 2024-25. Visit USImportdata and access the latest US export-import data or search live data on US palm oil imports by country. Contact us at info@tradeimex.in to get a customized US trade database report, along with a verified list of the top palm oil importers in the USA.
What's Your Reaction?