Copper Exporters & Suppliers in USA | US Copper Exports Data by Country 2025
Discover US copper exports database with verified copper exporters & suppliers in USA and updated data on US copper exports by country to track global market trends.

Copper is one of the most strategic industrial metals in the modern global economy. It is essential for power generation and transmission, construction, electronics, renewable energy systems, electric vehicles, defense equipment, and advanced manufacturing. As the world accelerates toward electrification and energy transition, copper demand has intensified, placing renewed focus on trade flows, supply chains, and national resource security. According to the latest US export data and copper export data of the USA, the total value of US copper exports reached $12.22 billion in 2024, a 12% increase from the previous year. According to the US copper export data, the US exported copper worth a total value of $9.29 billion in the first three quarters of 2025. Copper trade in the United States continues to expand as global demand rises, with copper suppliers USA playing a vital role in meeting both domestic and international requirements.
According to recent trade trends, US copper scrap exports have shown consistent movement toward major manufacturing hubs, reflecting strong recycling and secondary metal markets. Many industry stakeholders frequently ask, How much Copper does the US export, as export volumes fluctuate based on global pricing, industrial demand, and supply chain dynamics. The US is the 6th largest copper exporter in the world, as per the global trade data. In this context, the United States occupies a unique position. It is both a major copper producer and exporter & a significant importer of refined copper & copper-based products. The 2024–25 period has been especially important, marked by shifting trade patterns, strong export volumes, rising prices, and growing policy attention on domestic copper capacity.
This blog provides an in-depth, data-driven analysis of U.S. copper exports in 2024–25, identifies the biggest copper exporters in the U.S., examines key copper suppliers serving the American market, and explains the broader forces shaping the copper trade landscape.
Overview of the U.S. Copper Industry
The United States is among the world’s top copper-producing nations, with large-scale mining operations concentrated primarily in Arizona, Utah, New Mexico, Nevada, and Montana. Annual mine production in recent years has averaged around 1.1 million metric tons, placing the U.S. within the top five global producers.
However, domestic copper consumption consistently exceeds mine output. This structural gap is driven by:
-
High demand from construction and electrical infrastructure
-
Rapid growth in electric vehicles and renewable energy installations
-
Expanding data centers and semiconductor manufacturing
As a result, the U.S. relies on both exports and imports to balance its copper supply chain. Copper Exports mainly consist of copper ores, concentrates, scrap, and semi-processed products, while imports are dominated by refined copper cathodes, anodes, and fabricated copper goods.
U.S. Copper Industry Snapshot
|
Indicator |
2024–25 Estimate |
|
Mine production |
1.1 million metric tons |
|
Share of global production |
6% |
|
Domestic consumption |
Significantly higher than production |
|
Import reliance (refined copper) |
45% |
|
Total copper export value |
USD 12+ billion |
Despite strong domestic mining output, the U.S. remains structurally dependent on imports for refined copper due to limited smelting and refining capacity. This imbalance defines U.S. trade behavior.
Total U.S. Copper Exports in 2024–25
In 2024, total U.S. copper exports across all product categories were valued at over USD 12 billion, reflecting strong global demand and elevated copper prices.
Copper exports from the U.S. can be broadly classified into four categories:
-
Copper ores and concentrates
-
Refined copper and copper alloys
-
Copper scrap and secondary raw materials
-
Fabricated copper products such as rods, bars, wire, and tubing
Among these, ores, concentrates, and scrap account for the majority of export volume, while fabricated products contribute higher value per unit but smaller quantities.
US Copper Exports by Country: Where Does the US Export Copper?
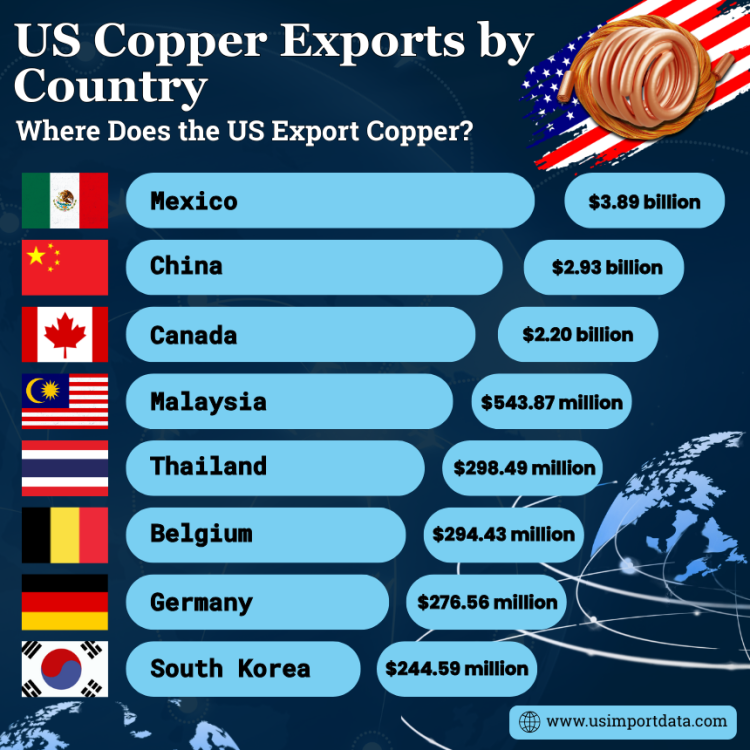
US Copper Exports by Country reveal that the United States distributes copper to numerous destinations globally. Key export destinations include Canada, China, Mexico, and Japan. These countries have consistently displayed significant demand for US copper exports, contributing to a substantial portion of the overall export volume. In examining US copper exports by country, we gain valuable insights into the destinations of America's copper products. The top 10 copper export destinations of the US, as per the US shipment data for 2024-25, include:
1. Mexico: $3.89 billion (31.9%)
Mexico is the largest importer of copper from the United States, accounting for nearly a third of total US copper exports. This strong trade relationship is driven by Mexico's growing manufacturing sector, which relies on copper for the production of electronics, wiring, and other goods.
2. China: $2.93 billion (24%)
China is another major destination for US copper exports, representing nearly a quarter of total exports, as per the data on US copper exports to China by HS code. As the world's largest consumer of copper, China relies heavily on imports to meet its domestic demand for this essential metal.
3. Canada: $2.20 billion (18%)
Canada, the US's neighbor to the north, is also a significant importer of copper from the United States. The close proximity between the two countries makes trade between them efficient and cost-effective, leading to a strong bilateral trade relationship in copper and other commodities.
4. Malaysia: $543.87 million (4.5%)
Malaysia is a growing market for US copper exports, driven by the country's expanding electronics and automotive industries, as per the data on US copper exports to Malaysia by HS code. As Malaysia's economy continues to develop, the demand for copper is expected to rise, creating new opportunities for US exporters.
5. Thailand: $298.49 million (2.4%)
Thailand is another emerging market for US copper exports, with the country's construction and infrastructure sectors driving demand for this versatile metal. US exporters are capitalizing on Thailand's growing economy by supplying high-quality copper products to meet the country's evolving needs.
6. Belgium: $294.43 million (2.4%)
Belgium serves as a gateway to the European market for US copper exporters, providing access to a wide range of industries that rely on copper for their operations. The strong trade ties between the US and Belgium facilitate the smooth flow of copper and other commodities between the two countries.
7. Germany: $276.56 million (2.3%)
Germany, known for its advanced manufacturing sector, is a key importer of US copper products. The high quality and reliability of US copper make it a preferred choice for German manufacturers, who require copper for various applications in automotive, machinery, and electronics production.
8. South Korea: $244.59 million (2%)
South Korea is an important market for US copper exports, driven by the country's booming technology and automotive industries. US exporters benefit from South Korea's demand for high-quality copper products, which are essential for the production of consumer electronics and vehicles.
9. India: $231.75 million (1.9%)
India is a fast-growing market for US copper exports, fueled by the country's rapid industrialization and urbanization. As India continues to modernize its infrastructure and manufacturing sectors, the demand for copper is expected to increase, providing lucrative opportunities for US exporters.
10. Japan: $204.09 million (1.7%)
Japan is a longstanding trading partner of the United States and a significant importer of US copper products. The strong demand for copper in Japan's electronics, automotive, and construction industries ensures a steady flow of US copper exports to this important market.
Top Copper Suppliers & Exporters in the USA: US Copper Exporters Database
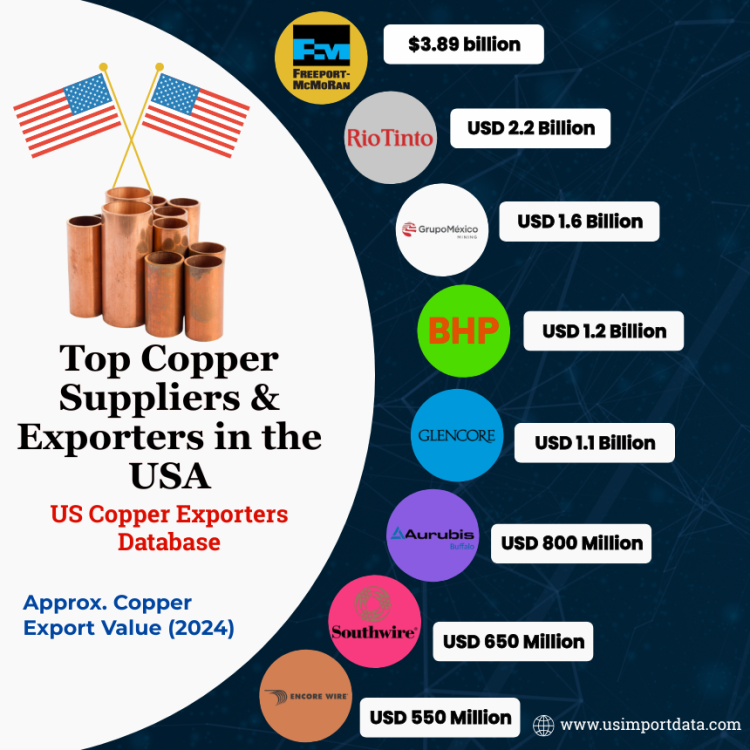
When it comes to sourcing top-quality copper, tapping into the US Copper Exporters Database is crucial for businesses seeking reliable suppliers. This database plays a vital role in connecting buyers with some of the top copper suppliers and exporters in the USA. The USA is recognized as a major copper exporter, with exporters of copper in USA supplying raw and refined copper to global markets, while a copper wire exporter plays a crucial role in meeting demand from electrical, construction, and manufacturing industries.
By leveraging this resource, companies can access a network of trusted suppliers known for their high-quality copper products and timely deliveries. The leading copper exporting companies in the US, as per the US copper exporters data & copper suppliers list for 2024-25, include:
|
Rank |
Company Name |
Approx. Copper Export Value (2024) |
Top Export Types |
Top Export Markets |
|---|---|---|---|---|
|
1 |
USD 4 Billion |
Copper ores & concentrates, copper cathodes |
Mexico, China, Canada, Spain |
|
|
2 |
Rio Tinto (U.S. operations – Kennecott) |
USD 2.2 Billion |
Copper concentrates, refined copper |
Canada, China, Japan |
|
3 |
Grupo México (ASARCO – U.S.) |
USD 1.6 Billion |
Copper concentrates, blister copper |
Mexico, Canada |
|
4 |
BHP (U.S. copper assets) |
USD 1.2 Billion |
Copper concentrates |
China, South Korea, Japan |
|
5 |
Glencore (U.S. sourcing & trading) |
USD 1.1 Billion |
Copper concentrates, secondary copper |
China, India, Europe |
|
6 |
Aurubis Buffalo / Aurubis USA |
USD 800 Million |
Copper cathodes, copper anodes, copper scrap |
Canada, Mexico, Germany |
|
7 |
Southwire Company LLC |
USD 650 Million |
Copper wire, rods, fabricated copper products |
Mexico, Canada, Latin America |
|
8 |
Encore Wire Corporation |
USD 550 Million |
Copper wire and cable |
Mexico, Canada, Caribbean |
|
9 |
OmniSource Corporation |
USD 500 Million |
Copper scrap, secondary copper raw materials |
China, Thailand, Malaysia |
|
10 |
Sims Metal (U.S. operations) |
USD 450 Million |
Copper scrap, mixed non-ferrous metals |
China, Southeast Asia, Canada |
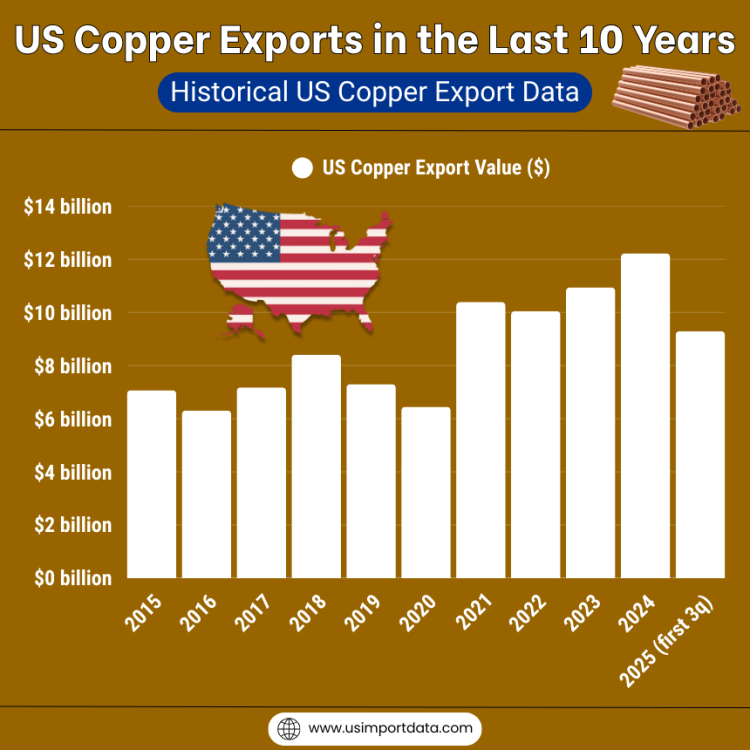
US Copper Exports in the Last 10 Years: Historical US Copper Export Data
|
Year of Trade |
US Copper Export Value ($) |
|
2015 |
$7.07 billion |
|
2016 |
$6.31 billion |
|
2017 |
$7.18 billion |
|
2018 |
$8.41 billion |
|
2019 |
$7.30 billion |
|
2020 |
$6.45 billion |
|
2021 |
$10.39 billion |
|
2022 |
$10.05 billion |
|
2023 |
$10.94 billion |
|
2024 |
$12.22 billion |
|
2025 (first 3 quarters) |
$9.29 billion |
Copper Ores and Concentrates: The Backbone of U.S. Copper Exports
Export Value and Volume
Copper ores and concentrates remain the single largest export category by value among U.S. copper shipments. In 2024, exports of copper ores and concentrates were valued at approximately USD 2.8 billion.
This segment is driven by the fact that:
-
The U.S. produces significant quantities of copper concentrate
-
Domestic smelting and refining capacity is limited compared to production
-
Many overseas buyers, particularly in Asia, have extensive smelting infrastructure
Top Destinations for U.S. Copper Ores and Concentrates
-
Mexico: Mexico was the largest destination for U.S. copper ores and concentrates in 2024, accounting for well over half of the total export value in this category. Proximity, integrated North American supply chains, and established processing facilities make Mexico a natural export market for U.S. copper miners.
-
Canada: Canada ranked second, benefiting from close trade ties, efficient cross-border trade, and shared industrial supply chains. Canadian smelters and refiners rely on U.S. concentrates to supplement domestic production.
-
China: China remained a key destination despite geopolitical tensions. Its dominance in global copper smelting means Chinese buyers continue to import copper concentrates from diverse sources, including the U.S., to keep processing capacity fully utilized.
-
Other Markets: Smaller volumes were shipped to countries such as Spain, India, Malaysia, Belgium, and Thailand. These shipments typically serve specialized smelters or trading hubs rather than large-scale consumption markets.
U.S. Copper Scrap and Secondary Copper Exports
Importance of Copper Scrap in Global Trade
Copper scrap plays an increasingly critical role in global copper supply. Recycling copper requires far less energy than mining and refining primary copper, making scrap a strategic resource in a world focused on sustainability and emissions reduction.
The U.S. is one of the world’s largest generators of copper scrap due to:
-
A mature industrial base
-
Extensive electrical infrastructure
-
High rates of equipment replacement and demolition
Export Performance in 2024–25
In 2024, the U.S. exported nearly 1 million metric tons of copper scrap and secondary copper raw materials, representing year-on-year growth of close to 9 percent. This made copper scrap one of the fastest-growing components of U.S. copper exports by volume.
Key Export Destinations for Copper Scrap
-
China: China remained the largest importer of U.S. copper scrap, accounting for more than 40% of total export volume. Chinese refiners & processors depend heavily on imported scrap to offset concentrate shortages & manage costs.
-
Canada: Canada was the second-largest destination, supported by integrated recycling and manufacturing supply chains across North America.
-
Southeast Asia: Countries such as Thailand and Malaysia increased scrap imports from the U.S., reflecting the region’s expanding secondary copper processing capacity.
U.S. Copper Scrap Export Volume
|
Year |
Export Volume (Metric Tons) |
|
2023 |
880,000 |
|
2024 |
960,000 |
|
2025 (projected) |
1,000,000 |
Fabricated Copper Products Exported from the U.S.
While the U.S. is not a dominant exporter of finished copper products compared to countries like China or Germany, it does ship meaningful volumes of:
-
Copper wire and cable
-
Copper rods and bars
-
Copper tubes and fittings
These exports are typically higher-value and serve niche industrial applications. Major destination markets include Mexico, Canada, India, and parts of Latin America, where U.S. suppliers are valued for quality consistency and technical specifications.
Copper Suppliers to the U.S. Market: Imports vs Exports
Despite strong export activity, the U.S. remains import-dependent for refined copper, as per the US copper imports by country.
Leading Copper Suppliers to the USA
-
Chile: Chile is the largest supplier of refined copper to the U.S., accounting for roughly one-third or more of total imports. Its vast reserves, efficient mining sector, and advanced refining capacity make it the most reliable source of copper cathodes.
-
Canada: Canada is the second-largest supplier, benefiting from geographic proximity and trade integration. Canadian copper shipments include refined copper, alloys, and semi-finished products.
-
Mexico and Peru: Mexico and Peru are important suppliers of both refined copper and copper intermediates, supporting U.S. manufacturing and construction industries.
-
Europe and Asia: Countries such as Germany, South Korea, and China supply higher-value fabricated copper products and specialized alloys rather than bulk cathodes.
Pricing Trends and Market Conditions in 2024–25
Copper prices surged significantly during 2024 and into 2025, reaching historic highs. Several factors contributed:
-
Tight global concentrate supply
-
Delays in new mine development
-
Strong demand from EVs, renewable energy, and data centers
-
Speculative investment and hedging activity
-
Trade policy uncertainty
Higher prices increased the dollar value of U.S. copper exports even when volumes remained stable.
Trade Policy and Regulatory Environment
Copper has become a strategic material in U.S. industrial and national security policy.
Key policy developments affecting exports and imports include:
-
Investigations into copper import dependency
-
Proposed tariffs on certain copper products
-
Discussions around restricting copper scrap exports to retain material for domestic processing
These measures aim to:
-
Strengthen domestic copper supply chains
-
Encourage investment in U.S. refining and smelting
-
Reduce reliance on foreign refined copper
However, they also introduce uncertainty for exporters and international buyers.
Outlook for U.S. Copper Exports in 2025 and Beyond
The medium-term outlook for U.S. copper exports remains positive but complex.
Growth Drivers
-
Rising global copper demand
-
Strong recycling volumes
-
Stable exports of ores and concentrates
Challenges
-
Limited domestic refining capacity
-
Potential restrictions on scrap exports
-
Trade tensions and tariffs
-
Environmental permitting hurdles
The U.S. is likely to remain:
-
A major exporter of copper concentrates and scrap
-
A net importer of refined copper
-
An increasingly strategic player in global copper trade discussions
Conclusion and Final Thoughts
In conclusion, the U.S. copper export landscape in 2024–25 reflects both strength and structural imbalance. The country exports billions of dollars’ worth of copper ores, concentrates, and scrap each year, with Mexico, Canada, & China as key destinations. At the same time, it relies heavily on imports of refined copper from Chile and other producing nations to meet domestic demand.
As electrification accelerates and copper becomes even more critical to economic and energy security, U.S. copper exports and imports will remain under scrutiny. Understanding these trade flows is essential for manufacturers, traders, policymakers, and investors navigating the evolving American copper market.
For more insights into the latest US import-export data, or to search live data on US copper exports by country, visit USImportdata. Contact us at info@tradeimex.in for customized trade reports, market insights, & a verified database of the top copper exporters in the USA, as per your requirement.
What's Your Reaction?