US Tea Imports by Country 2024-25: Top Tea Buyers & Importers in USA
US Tea Imports by Country covering major Tea Importers in USA and active Tea Buyers in USA. Get insights into US tea imports and sourcing trends.

Introduction
Tea is one of the most consumed beverages worldwide, second only to water. In the United States, tea has a unique profile: while it is less entrenched in everyday ritual than in Asia or Europe, it has carved out a strong space through iced tea, herbal infusions, and the growing specialty and wellness tea markets. Since domestic tea cultivation in the U.S. is negligible, the country relies heavily on imports to meet its consumption needs. According to the US import data and the Tea import data of the USA, the total value of US tea imports reached $578.57 million in 2024, an 11% increase from the previous year. US tea imports reached a total quantity of 123.36 thousand tons in 2024, representing an 18% increase from the previous year. According to the US tea import data and US import statistics, the US imported tea worth $296 million in the first two quarters of 2025. The growing interest in premium global blends has made importing tea to usa a thriving business, supported by a diverse list of tea importers in usa that source leaves from major tea-producing regions.
The Big Picture: U.S. Tea Import Market 2024
-
Total Import Value (2024): USD 578.6 million
-
Total Import Volume (2024): 123,362 tons
-
Year-on-Year Growth: +11% in value, +18.8% in volume compared to 2023
-
Average Unit Import Price: Declined by around 14%, reflecting a buyer’s market
In volume terms, black tea dominated with over 105,500 tons (about 85.5% of imports), while green tea accounted for nearly 17,800 tons (about 14.5%). Organic tea imports surged 113% to reach 4,688 tons, a sign of the growing demand for clean-label and certified products, though they remain a small fraction of the overall 2024 US tea import market.
The U.S. ranked as the second-largest tea importer globally in 2024, accounting for nearly 8% of world tea imports. This underscores how vital imports are to the American tea economy.
US Tea Imports by Country: Where Does the US Import Tea From?
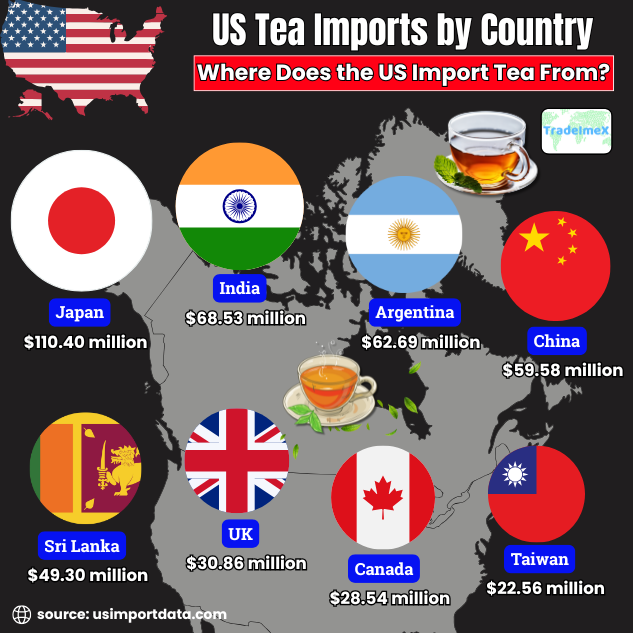
US tea imports by country provide valuable insight into the sources of tea that the US relies on. In recent years, Japan has consistently been the leading supplier of tea to the US, showcasing the strong historical ties between the two countries in the tea trade. Following Japan, India also plays a significant role as a key importer of tea to the US, contributing to the diverse tea market available to American consumers. Other notable countries that the US imports tea from include China, Sri Lanka, and Kenya, each offering its unique flavors and varieties to cater to the diverse preferences of tea enthusiasts in the US market. In the United States, tea consumption continues to rise, leading to an increase in tea imports from various countries. The top 10 import partners of the US for tea imports, as per the US shipment data and US tea imports by country for 2024-25, include:
1. Japan: $110.40 million (19.1%)
Japan is a significant player in the global tea market, known for its high-quality green teas such as matcha and sencha. In 2024-25, the US imported tea worth $110.40 million from Japan, accounting for 19.1% of total tea imports, as per the data on US tea imports from Japan. Japanese tea is prized for its unique flavor profiles and health benefits, making it a favorite among tea enthusiasts in the US.
2. India: $68.53 million (11.8%)
India is another major tea producer and exporter, renowned for its aromatic Darjeeling and Assam teas. With tea imports totaling $68.53 million in 2024-25, India held an 11.8% share of the US tea market. Indian teas are popular for their bold flavors and rich heritage, appealing to a diverse range of consumers in the US.
3. Argentina: $62.69 million (10.8%)
Argentina is a rising star in the global tea industry, known for its refreshing and citrusy yerba mate tea. The US imported tea worth $62.69 million from Argentina in 2024-25, representing 10.8% of total tea imports. Argentine yerba mate has gained popularity in the US for its unique taste and energizing properties, attracting health-conscious consumers.
4. China: $59.58 million (10.3%)
China is one of the oldest tea-producing countries in the world, offering a wide variety of teas such as white, green, oolong, and black tea. With $59.58 million worth of tea imports in 2024-25, China accounted for 10.3% of the US tea market, as per the data on US tea imports from China by HS code. Chinese teas are known for their delicate flavors and cultural significance, catering to tea connoisseurs in the US.
5. Sri Lanka: $49.30 million (8.5%)
Sri Lanka, formerly known as Ceylon, is famous for its robust black teas like Ceylon Orange Pekoe. The US imported tea valued at $49.30 million from Sri Lanka in 2024-25, capturing an 8.5% share of total tea imports. Sri Lankan teas are cherished for their bold and brisk flavors, making them a favorite choice for tea drinkers in the US.
6. United Kingdom: $30.86 million (5.3%)
The United Kingdom has a long-standing tea culture and is known for its traditional black teas like English Breakfast and Earl Grey. With tea imports of $30.86 million in 2024-25, the UK accounted for 5.3% of the US tea market. British teas have a loyal following in the US, valued for their rich history and comforting taste.
7. Canada: $28.54 million (4.9%)
Canada is a close neighbor to the US and shares a similar love for tea, with a preference for diverse blends and flavors. In 2024-25, the US imported tea worth $28.54 million from Canada, making up 4.9% of total tea imports. Canadian teas offer a unique fusion of global influences, appealing to adventurous tea drinkers in the US.
8. Taiwan: $22.56 million (3.9%)
Taiwan is renowned for its high-mountain oolong teas, characterized by their floral aroma and complex taste profiles. Tea imports from Taiwan totaled $22.56 million in 2024-25, representing 3.9% of the US tea market. Taiwanese teas are prized for their craftsmanship and terroir, attracting tea aficionados seeking premium-quality brews.
9. United Arab Emirates: $21.73 million (3.8%)
The United Arab Emirates may not be a traditional tea-producing country, but it has emerged as a key player in the tea trade with its diverse tea offerings. With imports worth $21.73 million in 2024-25, the UAE held a 3.8% share of the US tea market. Emirati teas reflect the country's multicultural heritage, enticing US consumers with exotic and innovative blends.
10. Poland: $19.23 million (3.3%)
Poland may not be a top tea exporter, but it has carved a niche for itself in the global tea market with its unique herbal and fruit infusions. Tea imports from Poland amounted to $19.23 million in 2024-25, making up 3.3% of total tea imports. Polish teas are valued for their natural ingredients and soothing properties, appealing to health-conscious consumers in the US.
List of Top Tea Buyers & Importers in USA: US Tea Importers Database
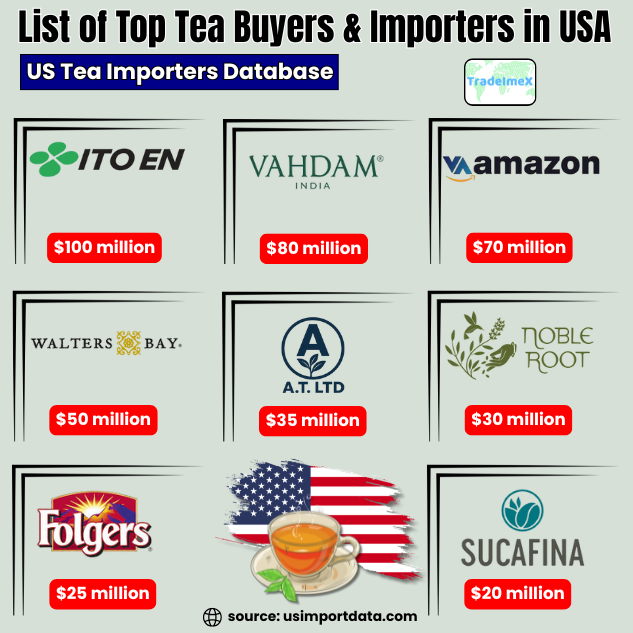
Importing tea into the US has become a thriving business as demand for specialty and premium blends continues to rise. Many Tea importers in USA actively source high-quality teas from countries like India, China, and Sri Lanka, catering to the diverse preferences of American consumers. A detailed Tea importers list helps businesses and suppliers connect with reliable tea importers who handle everything from bulk shipments to specialty teas. These tea importers play a key role in bridging global producers with local distributors, while trusted tea buyers ensure quality standards are met. With a growing number of tea buyers & a list of tea importers in USA seeking unique flavors and sustainable sourcing, the market presents vast opportunities for global exporters.
The US Tea Importers Database is a valuable resource for businesses looking to establish partnerships or expand their market presence in the tea industry. This database provides a comprehensive list of the top tea buyers and importers in the United States, offering valuable insights into key market players. The leading tea importers & buyers in the USA, as per the verified US tea importers data and the US tea buyers list for 2024-25, include:
|
Rank |
Company Name |
Approx. Import Value (2024) |
Main Imported Tea Types |
Top Import Sources |
|
1 |
ITO EN (North America) Inc. |
$100 million |
Green tea, RTD teas, matcha |
Japan, China |
|
2 |
$80 million |
Loose-leaf teas, blends, wellness teas |
India, Sri Lanka |
|
|
3 |
Amazon.com Services Inc. |
$70 million |
Packaged teas, tea bags, flavored/herbal teas |
Multi-origin (India, China, Sri Lanka) |
|
4 |
Walter’s Bay International LLC |
$50 million |
Tea bags, flavored blends, & herbal teas |
Sri Lanka, China, India |
|
5 |
A.T. LTD. |
$35 million |
Packaged teas, standard blends |
India, Sri Lanka |
|
6 |
Noble Roots Urban Garden |
$30 million |
Herbal teas, health-focused blends |
Latin America, Asia |
|
7 |
The Folger Coffee Company |
$25 million |
Bulk black teas for blends |
Argentina, India, Kenya |
|
8 |
Sucafina North America Inc. |
$20 million |
Bulk teas, blends, foodservice supply |
Kenya, India, China |
|
9 |
Keurig Green Mountain Inc. |
$15 million |
Tea bags, flavored and mainstream teas |
India, Sri Lanka, China |
|
10 |
Henry P. Thomson, Inc. |
$14 million |
Bulk black tea, iced tea bases |
Argentina, India, Sri Lanka |
US Tea Imports in the Last 10 Years: Historical US Tea Import Data
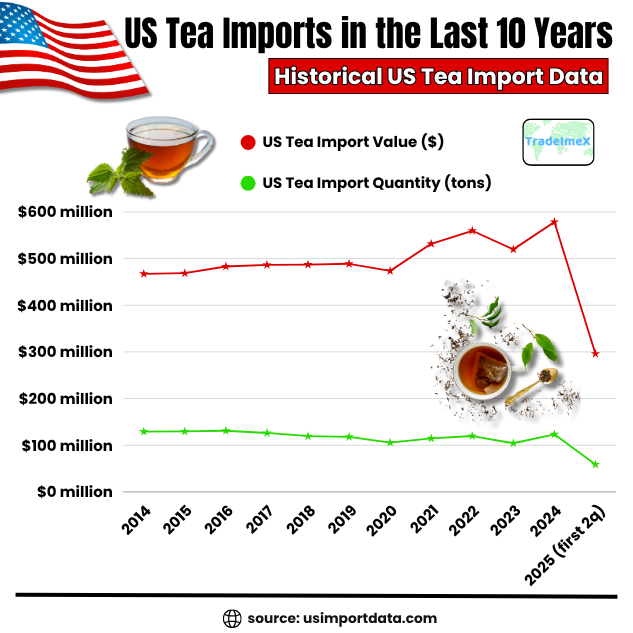
|
Year of Imports |
US Tea Import Value ($) |
US Tea Import Quantity (tons) |
|
2014 |
$467.32 million |
129.24 thousand tons |
|
2015 |
$468.73 million |
129.70 thousand tons |
|
2016 |
$483.12 million |
131.06 thousand tons |
|
2017 |
$486.55 million |
126.29 thousand tons |
|
2018 |
$487.20 million |
119.34 thousand tons |
|
2019 |
$488.87 million |
117.96 thousand tons |
|
2020 |
$473.68 million |
105.68 thousand tons |
|
2021 |
$531.71 million |
114.66 thousand tons |
|
2022 |
$559.65 million |
119.68 thousand tons |
|
2023 |
$519.78 million |
104.22 thousand tons |
|
2024 |
$578.57 million |
123.36 thousand tons |
|
2025 (first 2 quarters) |
$296.01 million |
58.62 thousand tons |
Top Tea-Supplying Countries to the U.S.
Five countries dominate the tea supply to the American market, together contributing over 60% of the total import value. Each has a distinct role:
1. Japan
-
Import Value 2024: USD 110 million
-
Key Strengths: High-quality green teas such as matcha, sencha, and gyokuro
-
Market Role: Premium and specialty segment catering to consumers seeking health benefits and authentic Japanese tea culture
Japan leads U.S. imports by value due to the high unit price of its teas. Even though the volumes are smaller compared to bulk black tea suppliers, Japan’s green tea commands a premium price, driven by rising demand for matcha and ceremonial-grade teas in cafes, wellness spaces, and foodservice.
2. India
-
Import Value 2024: USD 68 million
-
Key Strengths: Black tea (Assam, Darjeeling), orthodox, and specialty teas
-
Market Role: Widely used in blends, chai, and premium categories
India is a cornerstone of U.S. imports, supplying both bulk black tea and higher-end orthodox teas. Darjeeling teas, though niche, have a loyal following among specialty retailers, while Assam teas contribute to mass-market blends and chai products.
3. Argentina
-
Import Value 2024: USD 62 million
-
Key Strengths: Bulk black tea suited for iced tea blends
-
Market Role: Commodity supplier to the massive iced tea segment in the U.S.
Nearly half of the black tea imported into the U.S. in 2024 came from Argentina. Its tea is prized not for delicate flavors but for clarity, strength, and consistency when brewed cold, essential for iced tea, which accounts for about 80% of U.S. tea consumption.
4. China
-
Import Value 2024: USD 59 million
-
Key Strengths: Both green and black teas, specialty teas, and instant tea powders
-
Market Role: A versatile supplier across categories, from low-cost blends to premium green teas
China supplied nearly equal amounts of black and green tea to the U.S. in 2024, each accounting for about half of its shipments. It is also the single largest source of instant tea powders and extracts, which are used in ready-to-drink beverages, functional teas, and food manufacturing.
However, China faces unique challenges in the U.S. market. Trade tensions, stricter organic certification rules introduced in 2024, and potential tariff hikes in 2025 may curb growth, forcing U.S. buyers to consider diversifying sourcing.
5. Sri Lanka
-
Import Value 2024: USD 49 million
-
Key Strengths: Orthodox Ceylon teas with strong aroma and flavor
-
Market Role: Mid-tier and premium black tea markets
Sri Lanka remains a respected supplier, offering teas with a distinct identity. While volumes are not as high as Argentina or India, Sri Lanka’s reputation for quality sustains steady demand in specialty retail and blending operations.
Beyond the Top 5: Other Key Players
-
Kenya: Known for strong black teas used in blends, Kenya supplied close to 1 million kg of black tea in 2023–24.
-
Indonesia and Vietnam: Provide smaller volumes of both black and green teas, often at competitive prices.
-
Ireland: Surprisingly significant in instant tea imports, as some processing and re-export occurs there.
These smaller contributors play niche roles but can gain importance as buyers diversify to manage risk.
Trends Shaping the US Tea Imports in 2024–25
1. Tariffs and Trade Policy
The biggest story heading into 2025 is the impact of tariffs. The U.S. has signaled reciprocal tariffs on imports from several key suppliers, including China, Japan, and Argentina. For Argentina, a 10% tariff applies, while Chinese teas may face significantly higher duties. Importers responded in 2024 by front-loading shipments to lock in lower costs.
2. Rise of Organic and Specialty Teas
Organic tea imports doubled in 2024, though from a small base. Stricter organic certification rules under the “Strengthening Organic Enforcement” program reshaped sourcing, forcing importers to verify documentation and sometimes switch suppliers. Specialty teas such as matcha, herbal blends, and functional teas with added health claims are expected to drive growth.
3. Green Tea Growth
Green tea imports rose by more than 26% year-on-year in 2024, reflecting consumer interest in wellness and antioxidant properties. Japanese and Chinese suppliers are the biggest beneficiaries of this trend.
4. Instant and Extracted Teas
Instant teas and tea extracts are gaining momentum as inputs for ready-to-drink beverages and flavored products. About one-third of U.S. instant tea imports by value came from China in 2024. This category is expected to expand with the growing functional beverage sector.
5. Falling Unit Prices
Despite volume growth, the average import price of tea fell nearly 14% in 2024. This reflects competitive global supply, currency effects, and importers’ success in sourcing cost-effective bulk teas, especially from Argentina and Kenya.
Top Tea Import Hubs in the U.S.
While national trade statistics dominate the conversation, it’s important to note that certain states function as major tea import gateways:
-
New York & New Jersey Ports: Leading entry points for specialty teas from India, Sri Lanka, and China.
-
California (Los Angeles/Long Beach): Gateway for Asian imports, including Japanese and Chinese teas.
-
Georgia (Savannah): Strong in bulk imports, especially for iced tea production in the Southeast.
-
Texas & Virginia: Serve as secondary hubs for warehousing and regional distribution.
The clustering of import hubs near large consumer markets and distribution networks ensures efficient nationwide supply.
Implications for Tea Importers and Buyers
-
Diversification Is Key: With tariff risks, importers must avoid over-dependence on one supplier and build multi-country sourcing strategies.
-
Premiumization for Margins: Profitability increasingly lies in specialty, organic, and value-added teas rather than bulk commodity teas.
-
Compliance Readiness: Documentation, organic certification, and residue testing are more critical than ever to ensure imports clear U.S. regulatory hurdles.
-
Inventory Management: Balancing stockpiling against tariff hikes with the cost of holding inventory will remain a challenge through 2025.
Outlook to 2025 and Beyond
Looking ahead, U.S. tea imports are expected to continue growing moderately, potentially reaching over USD 600 million by 2028. Black tea for iced tea will remain the largest segment, but growth will come disproportionately from green, organic, herbal, and instant teas.
However, tariffs and trade policies could reshape sourcing dramatically. If tariffs rise steeply on Chinese and Japanese teas, suppliers from Argentina, Kenya, and Sri Lanka may capture more share. Meanwhile, consumer demand for functional and health-oriented beverages will create new opportunities for suppliers that can meet organic and specialty criteria.
Conclusion and Final Thoughts
The U.S. tea import market in 2024–25 is both dynamic and uncertain. Imports surged in 2024, hitting nearly 123,000 tons and USD 579 million in value. Japan, India, Argentina, China, and Sri Lanka dominate supply, but each plays a distinct role, from Japan’s premium matcha to Argentina’s bulk iced-tea base.
Tariff pressures, stricter regulations, and shifting consumer trends will force buyers and suppliers to adapt quickly. For U.S. importers, success will hinge on diversification, quality focus, and supply chain resilience. For exporters, the ability to offer value-added, compliant, and competitively priced products will determine who captures the next wave of U.S. tea demand. Tea may be ancient, but in the U.S., the story of how it’s imported, blended, and consumed is still evolving, and 2025 marks a pivotal chapter in that journey.
We hope that you liked our insightful blog report on the US tea imports & importers data 2025. For more insights into the latest US export-import data, or to search live data on the US tea imports by country, visit USImportdata. Contact us at info@tradeimex.in for customized US trade reports, market insights, and an exclusive database of the top tea importers & buyers in the US, as per your requirements.
What's Your Reaction?