US Trade Surplus by Country 2024-25: Top Countries Having Trade Surplus with the US
Explore the US trade surplus by country and learn which countries have a trade surplus with the US. In 2024–25, the US trade deficit reached $3.35T in imports and $2.06T in exports.

In the ever-evolving landscape of global trade, the United States plays a pivotal role as one of the world's largest economies. Let's take a closer look at some of the top countries that fall into this category. Trade surpluses can have both positive and negative impacts on an economy, depending on various factors such as exchange rates, domestic consumption, and government policies. The US had a trade deficit in 2024-25, with US imports totaling $3.35 trillion, as per the US import data, while US exports reached $2.06 trillion, as per the US export data, indicating a higher import value than exports, based on the United States trade deficit by country.
As the US continues to engage in trade with various countries around the world, there has been a growing interest in analyzing which countries have a trade surplus with the US. From 2024 to 2025, several countries have emerged as key players in terms of having a trade surplus with the US. In calendar year 2024, the United States posted an overall US goods trade deficit of approximately –$1.205 trillion, as officially reported by the U.S. Census Bureau (seasonally adjusted total exports of $2.062 trillion versus imports of $3.356 trillion). When services (where the U.S. typically runs a surplus) are included, the total goods & services deficit reached around $918.4 billion, according to the U.S. Bureau of Economic Analysis.
Despite the overall trade shortfall, the U.S. maintained bilateral goods trade surpluses with a set of countries, meaning more goods were exported to those partners than imported from them. In this article, we will take a closer look at the top countries that had a trade surplus with the US in the years 2024-25, with a key focus on the US trade surplus by country.
What is a Trade Surplus?
Before we delve into the specifics of the top countries with a trade surplus with the US, let's first understand what a trade surplus means. A trade surplus occurs when a country exports more goods and services than it imports. This results in a positive balance of trade, as the country earns more from its exports than it spends on imports.
The balance of trade United States figures help explain the overall economic interactions between the U.S. and its global partners. Understanding what is the US trade balance involves looking at both US import exports numbers to determine whether the country is running a surplus or a deficit. What is a surplus in trade? It occurs when a country exports more than it imports. While the US trade deficit by country is well-documented—especially with nations like China—there are also examples of US trade surplus by country, such as with Hong Kong or the Netherlands. In fact, the USA trade surplus highlights key sectors where American products are in high demand. Examining US trade data by country allows analysts to pinpoint trade surplus countries and understand trends in global commerce. Though the United States trade surplus is less common overall, some industries still contribute to a positive US trade surplus in specific markets.
US Trade Surplus by Country in 2024-25
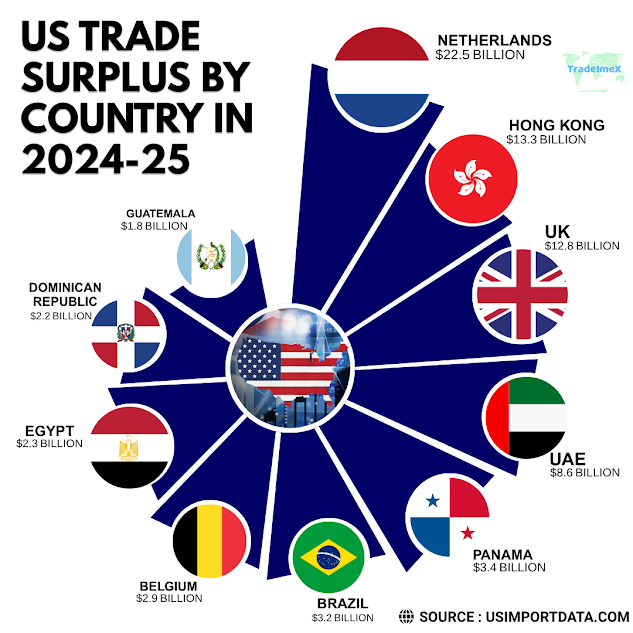
While the overall U.S. ran a goods trade deficit totaling nearly $1.2 trillion in calendar 2024, there were several countries with which it maintained a bilateral goods trade surplus. According to year‑to‑date (goods only) figures through May or similar, the top 10 partnered countries where the United States had a surplus, as per the US trade in goods by country, are:
|
Rank |
Country |
US Trade Surplus (Goods, $ billion) |
|
1 |
Netherlands |
$22.5 billion |
|
2 |
Hong Kong |
$13.3 billion |
|
3 |
United Kingdom |
$12.8 billion |
|
4 |
United Arab Emirates |
$8.6 billion |
|
5 |
Panama |
$3.4 billion |
|
6 |
Brazil |
$3.2 billion |
|
7 |
Belgium |
$2.9 billion |
|
8 |
Egypt |
$2.3 billion |
|
9 |
Dominican Republic |
$2.2 billion |
|
10 |
Guatemala |
$1.8 billion |
These ten countries represent the most significant cases where American goods exports outpaced imports in 2024.
Why These Countries Show Surpluses in U.S. Goods Exports
In recent years, the United States has experienced trade surpluses with certain countries around the world. These trade surpluses indicate that the U.S. is exporting more goods and services to these countries than it is importing. Let's take a closer look at the top 10 countries that have a trade surplus with the U.S. in 2024-25.
1. Netherlands: $22.5 billion
The Netherlands is the leading country when it comes to trade surplus with the United States. With a surplus of $22.5 billion, the Netherlands has a strong trade relationship with the U.S. This surplus indicates that the U.S. is exporting more to the Netherlands than it is importing, as per the data on US exports to Netherlands. The top surplus partner in goods trade, driven by U.S. exports of crude oil, agricultural commodities, and high‑value machinery and tech to the Dutch economy.
2. Hong Kong: $13.3 billion
Following closely behind the Netherlands is Hong Kong, with a trade surplus of $13.3 billion, largely concentrated in electronics, re‑export services, and high‑margin goods. Hong Kong's strong economy and strategic location make it a key trading partner for the U.S., resulting in a significant trade surplus.
3. United Kingdom: $12.8 billion
The United Kingdom is another country that has a substantial trade surplus with the U.S., amounting to $12.8 billion, reflecting strong demand in energy (notably LNG), pharmaceuticals, aerospace parts, and machinery. The close economic ties between the two countries contribute to this surplus, with the U.S. exporting more goods and services to the UK.
4. United Arab Emirates: $8.6 billion
The United Arab Emirates is a significant player in the global economy, and it also has a trade surplus with the U.S. of $8.6 billion, tied to U.S. exports of machinery, petrochemical intermediates, and tech. The oil-rich nation has a strong demand for U.S. goods and services, leading to this surplus.
5. Panama: $3.4 billion
Panama, known for its strategic canal and growing economy, has a trade surplus of $3.4 billion with the U.S. The strong trade relationship between the two countries benefits both parties, with Panama importing a significant amount of goods from the U.S.
6. Brazil: $3.2 billion
Brazil, a major player in the agricultural sector, has a trade surplus of $3.2 billion with the U.S, as per the data on US exports to Brazil. The two countries have a long history of trade relations, with Brazil exporting a variety of products to the U.S., contributing to the surplus. Brazil, notably, delivered $3.2 billion in surplus despite broader tensions over tariffs.
7. Belgium: $2.9 billion
Belgium is another European country that has a trade surplus with the U.S., totaling $2.9 billion. The strong economic ties between the two countries result in Belgium importing more goods and services from the U.S. than it exports.
8. Egypt: $2.3 billion
Egypt, with its growing economy and strategic location, has a trade surplus of $2.3 billion with the U.S. The U.S. exports a variety of goods to Egypt, including machinery, chemicals, and agricultural products, contributing to this surplus.
9. Dominican Republic: $2.2 billion
The Dominican Republic has a trade surplus of $2.2 billion with the U.S. The two countries have a strong trade relationship, with the U.S. exporting a variety of goods to the Dominican Republic, including machinery, electrical equipment, and agricultural products.
10. Guatemala: $1.8 billion
Rounding out the top 10 countries with a trade surplus with the U.S. is Guatemala, with a surplus of $1.8 billion. The U.S. exports a variety of goods to Guatemala, including machinery, electrical equipment, and agricultural products, contributing to this surplus.
Broader Context: The U.S. Trade Picture in 2024
-
The overall goods trade deficit in 2024 was approximately $1.211 trillion, up from $1.063 trillion in 2023.
-
After accounting for services, where the U.S. typically posts a surplus, the total goods & services deficit stood near $918 billion in calendar 2024.
-
Major deficit relationships included China ($295 billion), Mexico ($172 billion), the EU aggregate ($236 billion), Vietnam ($123 billion), Canada ($63 billion), and India ($45 billion).
Despite the overall deficit trend, the top-ten surplus countries, especially the Netherlands, Hong Kong, and the UK, play an outsize role in offsetting parts of that imbalance.
Key Insights & Trends
-
Outsize impact from small partners: Many surplus nations are not among the largest trading volumes (e.g. Netherlands or Hong Kong), yet specialized goods trade (e.g., energy, high‑end manufacturing components) pushes the U.S. into surplus territory.
-
Energy & raw materials: US Oil and US LNG exports underpin surpluses with European and Gulf states like the Netherlands, UK, UAE, and Brazil (for instance, the U.S. runs a surplus excluding oil in Canada)
-
Policy and geopolitical dynamics: Brazil surfaces as interesting: The U.S. had a surplus ($3.2 b) with it, yet recent tariff policies threaten that dynamic, reflecting political tension over judicial matters rather than trade volume logic.
-
Service trade offsets: While goods deficits dominate most bilateral relationships, in aggregate, services exports (e.g, digital, intellectual property, travel) help shave down the net deficit significantly. The U.S. services surplus in 2024 was $293 billion.
Why It Matters
-
Strategic trade planning: Knowing where the U.S. registers surpluses can help policymakers evaluate leverage in negotiations and focus on sectors with competitive strength.
-
Diversification & resilience: Even amid large deficits with giants like China and Mexico, surplus ties with nations like the Netherlands and the UK show where U.S. goods maintain a premium positioning.
-
Risk detection: Countries with small GDP or trade volume but large surpluses (e.g., Panama, Guatemala) may be vulnerable to demand or geopolitical shocks.
-
Energy dynamics: The strong surplus in EU partners and Gulf states underscores the role of energy exports in shaping trade flows, especially as global energy policies evolve.
Context, Drivers & Key Trends Behind US Trade Surplus
1. Energy and Raw Materials: Foundations of Surplus
Major U.S. exports in 2024 included crude oil, liquefied natural gas (LNG), machinery, aerospace equipment, and pharmaceuticals. Key surplus relationships, like with the U.K., Taiwan, and the Netherlands, reflect robust demand for U.S. energy and industrial goods.
2. High-Tech & Semiconductor Dominance
Taiwan’s surplus is heavily tech‑centric: U.S. exporters upgraded equipment and semiconductors to meet burgeoning Asian demand, tilting the balance toward U.S. exports in capital goods categories.
3. EU and Financial Services Offset
Though the U.S. runs goods surpluses with countries like the U.K., Belgium, and Ireland, it still registers overall deficits with the EU bloc due to service trade patterns and aggregate goods imports from larger EU economies like Germany and Ireland.
4. Smaller Partners, Solid Gains
Countries like Panama, the Dominican Republic, Guatemala, and Egypt show that surpluses aren’t limited to mega economies. Infrastructure, mining, agriculture, and small-scale manufacturing exports create positive balances for the U.S.
5. Politics & Tariffs Impacting Trade Relationships
New U.S. trade policies impose tariffs based on bilateral surplus ratios. Even countries enjoying U.S. surpluses like the U.K., Ireland, and Belgium face baseline duties, though EU deals were negotiated to cap tariffs at 10–15%.
Specifically, Brazil faces potential 50% tariffs despite maintaining a U.S. goods surplus ($7.4 B), due to political disputes rather than trade imbalances.
Strategic Insights & Implications
1. Surplus partners provide economic leverage
Countries showing goods-trade surpluses with the U.S., especially the U.K., Taiwan, and Brazil, highlight areas of American export strength. Diplomatically and economically, policymakers can target support for these competitive industries.
2. Diversification is key
While deficits with China, Mexico, and Canada dominate headlines, surplus relationships underline niches where the U.S. leads: energy exports, aerospace, pharmaceuticals, and semiconductors.
3. Tariff policies may blunt export growth
Even surplus partners are not immune to U.S. tariff strategies, which target imbalances directly. The formula used (surplus/export over bilateral flows) applies even to friendly economies, creating unpredictability in future trade cost structures.
4. Reliance on smaller partners carries risk
Countries like Panama or Guatemala may have volatile trade relationships—if demand shifts or geopolitical tension arises, even modest U.S. surpluses could evaporate quickly.
5. Service surpluses mask goods deficits
The U.S. services sector added about $293 billion in surplus during 2024, lowering the total goods & services deficit to about $918 billion. Strategic trade policy must therefore consider both goods and services.
Key Takeaways on US Trade Surplus by Country
-
Top Surplus Partners (2024): Netherlands, Hong Kong, UK, UAE, Panama, Brazil, Belgium, Egypt, Dominican Republic, Guatemala.
-
Core drivers: exports of energy commodities, pharmaceuticals, high‑end machinery, aerospace, and agricultural tech.
-
Outlook: Policy changes, new tariffs, or trade deals could reshape these surplus relationships in 2025 and beyond. Keep a close eye on evolving US-Brazil, US-EU, and US‑Middle East structures.
Conclusion and Final Thoughts
In 2024, the U.S. ran a sizable goods trade deficit overall, yet surpluses with at least 111 nations helped partially offset that gap. The top 10 surplus partners, led by the Netherlands ($22.5B), Hong Kong ($13.3B), the U.K. ($12.8B), the UAE, Brazil, and others, reflect concentrated excellence in exports of energy, machinery, pharmaceuticals, and aerospace goods.
While big deficits with powerhouses like China, Mexico, the EU, Vietnam, and India dominate headlines, these surplus relationships reveal pockets of strength and opportunity for U.S. exporters, and areas where trade disputes or tariff shifts might have the greatest impact. Despite robust bilateral surpluses, evolving tariff regimes and political tensions, especially with countries like Brazil and EU states, pose challenges to sustaining export momentum. As trade policy adapts in 2025 and beyond, policymakers and analysts alike should monitor these relationships closely.
We hope that you liked our insightful & data-driven blog report on the US trade surplus by country 2025. For more such insights into the latest US trade data or to search live US import-export data by country, product, or HS code, visit USImportdata. Contact us at info@tradeimex.in and get a customized database report, along with a verified list of the top US importers & top exporters in the US.
Also read about:
Exploring US Trade Balance by Country
What's Your Reaction?