Decoding the US Trade Deficit 2024-25: Causes and Implications
Discover the key causes and implications of the US trade deficit for 2024-25. Explore trade trends, import-export data, tariff impacts, and economic forecasts in our in-depth analysis.

The US trade deficit accounted for $918.4 billion in 2024, an increase of 17% from 2023, driven by a jump in imports surpassing exports. In recent years, the US trade deficit has been a topic of much discussion and debate. With the ongoing trade wars and shifting global economic dynamics, the trade deficit has become a focal point for policymakers, economists, and the general public. According to the US import data, the US imports of goods reached a total value of $3.35 trillion in 2024, a 6% increase from the last year, while the US exported goods worth $2.06 trillion in 2024, a 2% rise from the previous year, as per the US export data.
This US trade data clearly shows that the US imported more goods than it exported in 2024-25. In this article, we will delve into the causes of the US trade deficit for the years 2024-25 and explore the implications it has for the US economy and beyond.
The US Trade Deficit set a Record in 2024 as Imports Surged
Last year, the US imports increased due in part to a strong dollar, but export growth was only moderate. A strong U.S. currency hindered export growth, while American consumers snatched up imported goods, causing the U.S. trade imbalance in goods to reach a record $1.2 trillion last year. At $295.4 billion, the U.S. had the biggest goods trade imbalance with China, followed by the EU, Mexico, Vietnam, and Ireland. The trade deficit has long been viewed by President Trump as an indication of economic weakness, and the data may provide him with justification for trade sanctions or other critiques of other nations.
Understanding the US Trade Deficit
Before we dive into the specific causes and implications of the US trade deficit for 2024-25, it's essential to understand what the trade deficit is. The trade deficit occurs when a country imports more goods and services than it exports. In other words, it represents the difference between the value of a country's imports and exports.
For the US, the trade deficit has been a persistent issue for several decades. The country has consistently imported more than it has exported, leading to a trade deficit that has grown to significant levels. This has raised concerns about the impact of the trade deficit on the US economy, job market, and overall competitiveness in the global economy.
-
Imports vs. Exports: The growing gap was a result of imports rising higher than exports.
-
Important Trading Partners: China, the EU, Mexico, and Vietnam have the biggest trade deficits.
-
Increased attention: With President Trump's return to the White House, there is heightened attention surrounding the growing deficit.
-
Tariffs: Concerning trade and other matters, such as drug trafficking and illegal immigration, Trump has threatened to impose tariffs on important US allies.
Particular Deficit Sums with US Trade Partners:
-
EU: $235.6 billion
-
China: $295.4 billion (as per the data on US exports to China and US imports from China)
-
Mexico: $171.8 billion
-
Vietnam: $123.5 billion
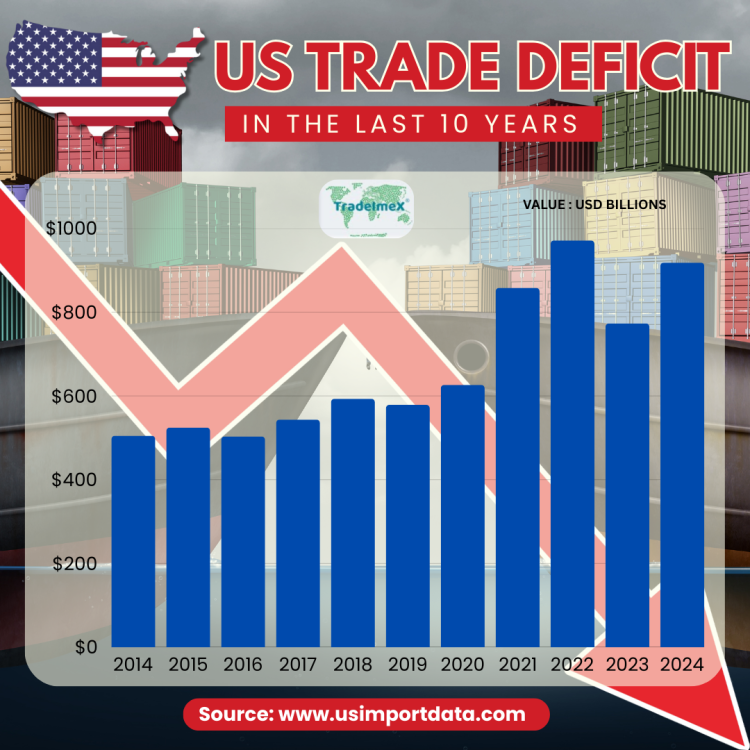
US Trade Deficit in the Last 10 Years: Yearly Data on US Trade Deficit
|
Year of Trade |
Total US Trade Deficit ($) |
|
2014 |
$505 billion |
|
2015 |
$524.3 billion |
|
2016 |
$503.3 billion |
|
2017 |
$543.3 billion |
|
2018 |
$593.1 billion |
|
2019 |
$578.5 billion |
|
2020 |
$626.4 billion |
|
2021 |
$858.2 billion |
|
2022 |
$971.1 billion |
|
2023 |
$773 billion |
|
2024 |
$918.4 billion |
Causes of the US Trade Deficit 2024-25
-
Strong US Dollar: One of the primary causes of the US trade deficit for 2024-25 is the strength of the US dollar. A strong dollar makes US exports more expensive for foreign buyers while making imports cheaper for US consumers. This dynamic can lead to an increase in imports and a decrease in exports, contributing to a growing trade deficit.
-
Global Economic Conditions: The global economic environment plays a significant role in shaping the US trade deficit. Economic slowdowns in key trading partners, geopolitical tensions, and shifting consumer preferences can all impact the balance of trade. Economic conditions in 2024-25 are likely to influence the direction of the US trade deficit.
-
Trade Policies: Trade policies and US trade agreements are another factor that can affect the US trade deficit. Tariffs, trade barriers, and trade agreements can impact the flow of goods and services between countries, influencing the trade balance. Changes in trade policies in 2024-25 could have implications for the US trade deficit.
-
Consumer Spending: Consumer spending habits can also contribute to the US trade deficit. A strong demand for foreign goods and services, coupled with a relative lack of competitiveness in certain US industries, can lead to higher levels of imports. This can further widen the trade deficit.
Implications of the US Trade Deficit 2024-25
-
Economic Growth: The trade deficit can have implications for overall economic growth. A persistent trade deficit can constrain economic growth by reducing exports, impacting industries that rely on international trade, and potentially leading to job losses.
-
Currency Value: It can also influence the value of the US dollar. A widening trade deficit can put downward pressure on the value of the dollar, affecting inflation, interest rates, and overall economic stability.
-
Global Competitiveness: A large trade balance can impact the competitiveness of US industries in the global market. It can lead to a loss of market share, reduced investment in domestic industries, and potential long-term implications for the US economy's competitiveness.
-
Political and Social Consequences: The USA trade deficit can also have political and social consequences. Rising trade deficits can fuel anti-trade sentiments, protectionist policies, and tensions between trading partners. These dynamics can have far-reaching implications for international relations and global economic stability.
US Trade Deficit Trends (2024-2025)
|
Year |
Trade Deficit ($ Billion) |
Key Highlights |
|
2024 |
918.4 |
Record high deficit due to rising imports |
|
Jan 2025 |
131.4 |
Sharp increase from Dec 2024, driven by imports |
|
Feb 2025 |
147.9 |
Declined from Jan 2025 due to rising exports |
Key Takeaways
✔️ The U.S. trade deficit surged by 17% in 2024.
✔️ The goods deficit increased significantly, while the services surplus saw minimal changes.
✔️ Imports outpaced exports, driven by pre-tariff stocking and rising consumer demand.
USA Import and Export Dynamics
|
Year |
Exports ($ Billion) |
Imports ($ Billion) |
Key Drivers |
|
2024 |
3,191.6 |
4,110 |
Increased petroleum exports, but rising imports in consumer goods |
|
Jan 2025 |
178.6 |
326.5 |
Imports spiked before tariff imposition |
|
Feb 2025 |
+7.0 billion |
-0.6 billion |
Small export growth, slight import drop |
Key Trends
✔️ Petroleum exports reached a record surplus of $44.9 billion.
✔️ Consumer goods & tech products saw a rise in imports, especially in Q4 2024.
✔️ Businesses imported more ahead of expected tariffs, increasing the deficit.
Pricing & Market Trends
|
Factor |
Trend |
Impact |
|
Tariffs (Apr 2025) |
10%-50% on imports |
Higher costs for businesses & consumers |
|
Inflation |
Expected rise |
Car prices up by $4,000+ |
|
Stock Market |
Volatility post-tariff announcement |
Retail & manufacturing stocks fell |
|
U.S. Dollar Strength |
Appreciation |
Reduced competitiveness of exports |
Insights
✔️ The new tariffs have direct inflationary effects.
✔️ Retailers & manufacturers are raising prices to cover increased import costs.
✔️ The strong U.S. dollar is making exports less competitive globally.
Supply Chain & Shipments
|
Factor |
Status (2024-2025) |
Implication |
|
Pre-tariff imports |
Increased shipments in late 2024 |
Short-term surge in trade deficit |
|
Supply Chain Shifts |
Companies exploring alternative sources |
Some firms are pausing expansion |
|
Trade Partnership Strains |
Canada & Mexico affected by U.S. tariffs |
Risk of retaliatory tariffs |
Key Impacts
✔️ Companies rushed to import goods before tariffs, increasing the 2024 trade deficit.
✔️ Shift in supply chains is costly and slow, leading to uncertainty.
✔️ Retaliation from trade partners could further disrupt U.S. imports & exports.
Additional Causes of the Trade Deficit
|
Cause |
Effect |
|
Strong U.S. Dollar |
Made exports expensive & imports cheaper |
|
Tariff Anticipation |
Companies imported in bulk before tariffs hit |
|
Consumer Demand |
High domestic demand for foreign goods |
|
Global Economic Factors |
Slowing economies reduced demand for U.S. exports |
Observations
✔️ Pre-tariff stocking was a major contributor to the 2024 trade deficit.
✔️ The U.S. dollar strength is worsening the trade gap.
✔️ Global demand variations are impacting exports.
Economic & Market Implications
|
Impact |
Explanation |
|
GDP Growth |
Rising trade deficit reduces net exports, affecting economic growth |
|
Inflation Risk |
Tariffs will increase consumer prices |
|
Trade Relations |
Tariffs may strain diplomatic ties, causing countermeasures |
|
Stock Market |
Increased market volatility due to policy uncertainty |
Key Risks
✔️ Tariffs could hurt GDP growth due to higher consumer costs.
✔️ Inflation risks are real, especially for import-heavy industries.
✔️ Global trade partnerships are under strain, leading to uncertainty for businesses.
US Trade Deficit Trends 2025
After a downwardly corrected $98.1 billion loss in December 2024, the US reported a record trade deficit of $131.4 billion in January 2025, surpassing projections of a $127.4 billion deficit. Ahead of impending duties, imports jumped 10% to a record high of $401.2 billion. As per the Computer import data of the USA, computers ($3 billion), pharmaceutical preparations ($5.2 billion), and finished metal shapes ($20.5 billion) saw the largest increases. As per the Pharmaceutical export data of the USA, Pharmaceutical preparations ($0.8 billion) and civilian aircraft ($1.1 billion) drove the slower 1.2% increase in exports to $269.8 billion.
Conversely, sales of soybeans fell by $-0.8 billion. China ($-29.7 billion vs. $-25.2 billion in December 2024), the European Union ($-25.4 billion vs. $-20.4 billion), Switzerland ($-22.8 billion vs. $-13 billion), Mexico ($-15.5 billion vs. $-15.3 billion), Vietnam ($-11.9 billion vs. $-11.4 billion), and Canada ($-11.3 billion vs. $-7.9 billion) all saw an increase in the US goods trade gap.
Key Takeaways & Future Outlook
-
The U.S. trade deficit hit record levels in 2024, with 2025 showing continued challenges.
-
New tariffs (April 2025) will likely increase costs, reduce consumer spending, and impact global trade relations.
-
Inflation, supply chain shifts, and currency fluctuations will continue shaping the trade landscape.
-
If tariffs stay, import prices will rise further, adding inflationary pressure.
-
Companies may accelerate domestic production, but only in the long run.
-
Trade relations with Canada, Mexico, and China will determine U.S. export success.
Conclusion and Final Word
In conclusion, the US trade deficit for 2024-25 is influenced by a complex interplay of factors, including currency values, global economic conditions, trade policies, and consumer spending habits. The implications of the trade deficit are wide-ranging and can impact economic growth, currency values, global competitiveness, and political dynamics. Since the United States imports a wide range of goods, it may also be inferred that the country's supply cannot keep up with the demand of its population. In the upcoming years, the USA will undoubtedly plan its foreign business and turn a profit once more.
To conclude, we hope that you liked our insightful and interactive blog report on the US trade deficit for 2024-25. To know more about the latest USA market trends on US trade data, visit USImportdata. Contact us at info@tradeimex.in.
What's Your Reaction?