US Canada Trade Surplus and Balance Trends in 2025
Explore the US Canada trade surplus and trade balance with insights into US imports from Canada and US exports to Canada including trends behind the US trade deficit with Canada.
In today's global economy, trade relationships between countries play a crucial role in determining economic growth and stability. The trade balance between the United States and Canada is one such relationship that has significant implications for both countries. According to the US import data, the total value of US imports from Canada reached $422.17 billion in 2024, while the US exports to Canada accounted for $348.50 billion, as per the US export data, which resulted in a negative trade balance; hence, the US had a trade deficit with Canada in 2024-25. In the first nine months or the first three quarters of 2025, the United States exported goods worth $249.73 billion to Canada and imported $299.18 billion from Canada, resulting in a negative trade balance or trade deficit of -$49.43 billion.
Oil, gas, and other energy items make up a sizable amount of Canada's exports to the United States, as per the Canada export data. In 2025, the US-Canada trade balance, or the US trade deficit with Canada, was equivalent to 0.12% of the U.S. GDP, concerning total U.S. spending. The US would probably have a trade surplus with Canada if these energy exports didn't exist. In this data-driven report, we will analyze the US-Canada trade balance for the years 2024-25, highlighting key trends and factors influencing this important economic relationship.
Introduction: Why the US–Canada Trade Balance Matters
The United States and Canada share one of the world’s most extensive and integrated trade relationships. In 2024-25, the US bilateral trade with Canada continued to be vital, not just in sheer volumes but also in representing the largest two-way trading flow globally, as per the North America trade data. Understanding the balance between U.S. exports and imports with Canada or the Canada-US trade balance reveals the health of sectors like energy, autos, services, and manufacturing, and sheds light on policy debates around trade deficits, tariffs, and economic strategy.
Overview of US-Canada Trade Relations
The United States and Canada have a long-standing and deeply integrated trade relationship, with both countries being each other's largest trading partners, as per the data on Canada and US trade relations. The two nations share a border of over 5,500 miles, which facilitates the movement of goods and services between them. The North American Free Trade Agreement (NAFTA) and its successor, the United States-Mexico-Canada Agreement (USMCA), have further strengthened economic ties between the two countries.
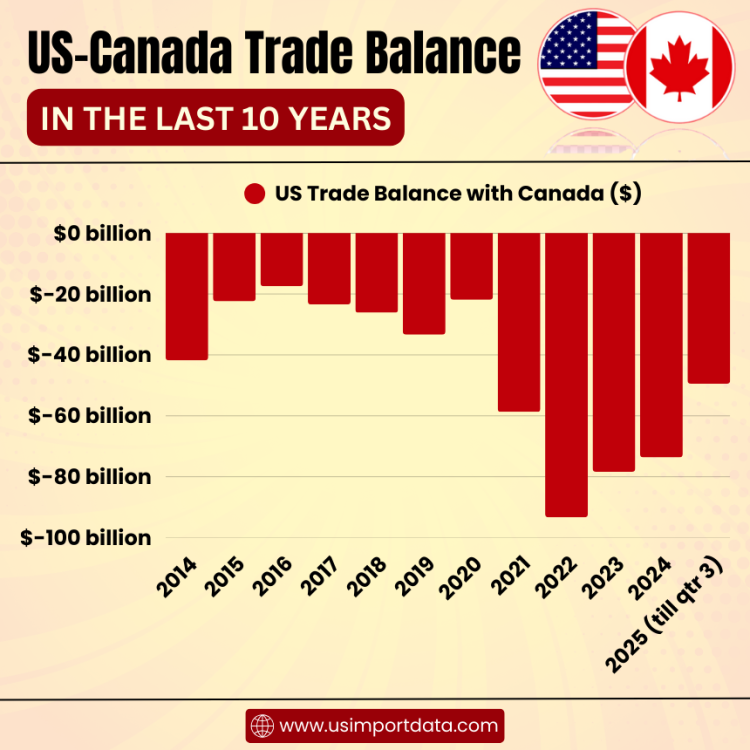
US-Canada Trade Balance in the Last 10 Years
|
Year of Trade |
US Trade Balance with Canada ($) |
|
2014 |
-$41.80 billion |
|
2015 |
-$22.38 billion |
|
2016 |
-$17.44 billion |
|
2017 |
-$23.43 billion |
|
2018 |
-$26.15 billion |
|
2019 |
-$33.33 billion |
|
2020 |
-$21.90 billion |
|
2021 |
-$58.71 billion |
|
2022 |
-$93.34 billion |
|
2023 |
-$78.35 billion |
|
2024 |
-$73.66 billion |
|
2025 (till quarter 3) |
-$49.43 billion |
Top-Line Numbers: The Latest US Trade Balance with Canada
According to the U.S. Census Bureau, the US posted a trade deficit in goods with Canada amounting to $73.6 billion in 2024, based on nominal monthly sums: exports totaled $348.5 billion and imports $422 billion. Latest data estimates the overall U.S. deficit (goods + services) with Canada at approximately $45 billion for 2024 (a modest –0.2% of U.S. GDP).
Another perspective from an independent analysis reported that the deficit in goods and services shrank to approximately $35.7 billion in 2024, thanks to declining imports and a stable export flow, according to the Centre for Future Work.
The President's claim that the U.S. "subsidizes" Canada by large sums was confirmed, revealing that the goods and services deficit was approximately $35.661 billion, or up to US $70.603 billion for goods only, far below exaggerated political claims.
Summary:
-
Goods only: U.S. imports exceed exports by $73 billion.
-
Goods + services: Deficit likely ranges between $36–45 billion.
Trends and Context: How Does 2024 Compare?
|
Year |
Goods Deficit with Canada (US$, billions) |
Goods + Services Deficit (US$, billions) |
|
2022 |
$98.3 billion (goods) |
n/a |
|
2023 |
$78.3 billion (goods) |
n/a |
|
2024 |
$73.6 billion (goods) |
$36–45 billion (goods + services) |
Key takeaways:
-
The U.S. trade deficit with Canada has shrunk from $78B in 2022 to $62B in 2024, a 21% improvement.
-
When services are included, the deficit narrows further due to a strong U.S. surplus in services with Canada.
Breakdown of Key Sectors
Energy & Oil
Canada remains the largest supplier of energy, especially oil, to the U.S. Roughly 60% of U.S. oil imports come from Canada. High energy prices have significantly fueled the goods deficit.
Autos & Manufacturing
Interestingly, the U.S. records a net trade surplus in autos and automotive parts with Canada, as per the data on US auto imports from Canada by HS code. The auto industry exemplifies the integrated North American supply chain, where components cross borders multiple times before final assembly.
Services
U.S. exports of services, like travel, business, tech, and financial services, have remained robust. The U.S. services surplus with Canada significantly offsets the goods deficit.
Why the Trade Deficit Isn’t a Crisis
1. Relative Size
The bilateral deficit with Canada accounted for only about 4% of the total U.S. trade deficit in 2024, tiny compared to deficits with China or Mexico.
2. Balanced Trade
Canada remained the largest U.S. export market in 2024, buying $440 billion worth of goods and services, or 14% of total U.S. exports.
3. Improving Trajectory
The deficit has steadily improved since its 2022 peak, thanks to lower energy prices, stabilized import demand, and strong U.S. service exports.
Political Narrative vs. Economic Reality
Exaggerated Claims
As fact-checkers noted, political statements that the U.S. "subsidizes" Canada by hundreds of billions are factually unsupported. Even combining trade deficit and defense spending gaps doesn’t approach $200 billion.
Tariffs & Trade Tensions
In 2025, tariffs escalated:
-
March 4: 25% tariff on most Canadian goods (10% on energy).
-
August 1: Tariff increased to 35% on most Canadian goods, with energy at 10%.
These actions reflect mounting trade friction, though they risk disrupting integrated supply chains, especially autos and energy.
Early 2025 Outlook: Data Signals Shifts
Canada’s June 2025 data showed:
-
Exports to the U.S. were up 3.1% month-over-month, yet still 12.5% lower year-over-year compared to June 2024.
-
Canada’s trade surplus with the U.S. in June: C$3.9B, slightly up from May, as per the data reports of Statistics Canada.
From the U.S. perspective, year-to-date changes and policy shifts may influence monthly balances, but full-year figures for 2025 are still pending.
What Lies Ahead? Risks and Scenarios
Tariff Escalation
Higher tariffs may temporarily shrink imports, but may also raise prices for U.S. consumers and businesses due to disrupted supply chains.
Energy Prices
Should energy prices rise again (due to global instability or supply constraints), the goods deficit could widen.
Services Growth
Unless service exports falter, they’ll continue mitigating the goods imbalance.
Trade Retaliation
Canada has already imposed retaliatory tariffs, signaling that escalation could provoke reciprocal economic damage.
Final Takeaways
-
2024’s US–Canada goods deficit stood at around US $62B, but the goods + services deficit is more likely between US $36B and $45B.
-
The deficit is significantly smaller than that with major partners like China or Mexico.
-
A robust U.S. services surplus with Canada partially offsets the goods imbalance.
-
Energy imports are a major driver of the goods deficit, although auto and manufacturing trade offsets it.
-
Political claims of massive subsidies via trade deficits are misleading; economic, trade, and defense data don’t support them.
-
The 2025 outlook is shaped by tariff policy, energy markets, services growth, and bilateral tensions.
Analysis of the US Trade Balance with Canada
2024 Trade Balance
In 2024, the United States had a trade surplus with Canada, with exports exceeding imports. The trade balance was driven by strong demand for US goods such as machinery, vehicles, and agricultural products in the Canadian market. On the other hand, imports from Canada, including crude oil, natural gas, and automotive products, also contributed to the trade balance.
2025 Trade Balance
In 2025, the US trade balance with Canada experienced a slight shift, with imports surpassing exports. This change was primarily driven by fluctuations in commodity prices and currency exchange rates. Despite the trade deficit, the United States continued to benefit from its close economic ties with Canada, leveraging its access to valuable natural resources and skilled labor.
Factors Influencing the US-Canada Trade Balance
Several factors influence the trade balance between the United States and Canada, including:
-
Economic Policies: Government policies related to trade, tariffs, and subsidies can impact the trade balance between the two countries.
-
Currency Exchange Rates: Fluctuations in currency exchange rates can affect the competitiveness of US and Canadian goods in the global market.
-
Commodity Prices: The prices of key commodities such as oil, natural gas, and agricultural products can influence trade flows between the two nations.
-
Market Demand: Shifting consumer preferences and demand for certain products can impact the trade balance.
Exchange Rates and Their Role in the Canada-US Trade Balance
A critical, though often overlooked, factor in the U.S.–Canada trade balance is the USD–CAD exchange rate. In 2024, the Canadian dollar averaged around 0.74–0.75 USD, reflecting a relatively weaker Canadian currency compared to historical norms.
This depreciation had several consequences:
-
For US exporters: American goods became more expensive in Canadian markets, dampening demand in some consumer categories (like machinery, electronics, and agricultural products).
-
For Canadian exporters: Canadian goods became more competitively priced in the U.S., particularly commodities like lumber, oil, and metals, which dominate the import side of the balance sheet.
-
For services trade: Exchange rates play a subtler role, but a weaker CAD tends to encourage Canadian tourism and spending in the U.S. while making U.S. services costlier in Canada. Still, the U.S. maintained a significant services surplus.
Overall, the exchange rate shift slightly widened the U.S. goods deficit but did not overturn the improving trend. The structural service surplus provided a cushion.
Regional Trade Flows: States and Provinces
The U.S.–Canada trade relationship isn’t abstract; it’s deeply regionalized. Some states depend heavily on Canadian trade:
-
Michigan: Auto and auto-parts exports/imports with Ontario form the backbone of its economy. In 2024, Michigan exported nearly $30 billion to Canada, its largest partner by far.
-
Texas: Energy imports from Alberta and Saskatchewan flow through Gulf refineries, making Texas one of the largest U.S. importers of Canadian crude.
-
New York and Ohio: Manufacturing and agricultural exports keep Canada as their top destination.
-
Pacific Northwest (Washington, Oregon): Softwood lumber imports from British Columbia remain a contentious but vital trade flow.
On the Canadian side:
-
Ontario and Quebec rely on U.S. demand for manufactured goods, machinery, and aerospace products.
-
Alberta and Saskatchewan dominate energy and agricultural exports southward.
-
British Columbia balances Asian markets with U.S. demand for wood, natural gas, and tech services.
Mapping these flows shows the mutual dependence: disruptions like tariffs or border slowdowns hit regional economies first, long before national GDP numbers show the impact.
Investment and Supply Chains
Beyond goods and services trade, foreign direct investment (FDI) is a pillar of the U.S.–Canada relationship. As of 2024:
-
The U.S. remained the largest foreign investor in Canada, with over $600 billion in assets spanning energy infrastructure, finance, technology, and manufacturing.
-
Canadian investment in the U.S. topped $580 billion, concentrated in real estate, energy, and consumer products.
This cross-investment blurs the trade deficit picture. For example, profits from U.S. companies operating in Canada often flow back to U.S. shareholders, softening the apparent goods deficit. Likewise, Canadian firms in the U.S. reinvest heavily in American jobs and infrastructure.
Supply chain integration also matters: many “imports” from Canada include U.S.-origin components shipped north, assembled or refined, then re-imported. Autos and aerospace are prime examples, where a car part may cross the border seven or eight times before final sale.
Labor Market Impacts
Trade balances are often judged by jobs. In 2024–25, the U.S.–Canada trade balance had mixed effects:
-
Energy Imports: U.S. reliance on Canadian oil supports refinery jobs in the Gulf but reduces U.S. demand for domestic crude.
-
Autos: The U.S. surplus in autos with Canada supports assembly plants in Michigan, Ohio, and Kentucky.
-
Services Surplus: Tech, financial, and business services exports from the U.S. to Canada support high-skilled employment clusters in New York, California, and Texas.
On the flip side, industries competing directly with Canadian imports (like lumber, steel, and aluminum) feel downward pressure, sparking past disputes and tariffs. Still, the balance of employment effects is far less dramatic than in U.S.–China trade, reinforcing the idea that the U.S.–Canada trade is more cooperative than adversarial.
The Big Picture: Interdependence Beyond Numbers
The US–Canada trade balance is not just a ledger entry. It’s the outcome of deep integration across supply chains, energy infrastructure, labor markets, and investment flows. Even with tariffs and political tensions, neither economy can decouple without severe costs.
Canada’s role as the U.S.’s largest export market underscores why most economists argue the trade balance should be seen in context: deficits matter less when they occur between tightly integrated, high-trust economies where capital, people, and technology flow in both directions.
Future Outlook
Looking ahead, the US-Canada trade balance is expected to remain closely tied to economic conditions and trade policies in both countries. The implementation of USMCA and ongoing efforts to address trade imbalances will continue to shape the bilateral trade relationship. With a focus on innovation, sustainability, and competitiveness, the United States and Canada can further strengthen their economic partnership and promote mutual prosperity.
Conclusion: Balanced Trade, not a Crisis
Despite its size, the US–Canada trade balance or deficit is relatively modest, and is mitigated by strong services exports and key sector surpluses like autos. The relationship is defined by integration, not imbalance. As we move through 2025, developments like tariffs and energy price shifts will shape the next chapter. But for now, the data shows a relationship that’s robust, mutually crucial, and far more nuanced than political rhetoric suggests.
In conclusion, the US-Canada trade balance for the year 2025 reflects the dynamic and interconnected nature of the economic relationship between the two countries. By analyzing key trends and factors influencing trade flows, policymakers and businesses can make informed decisions to support sustainable growth and development. As the United States and Canada navigate evolving global challenges and opportunities, a data-driven approach to trade relations will be essential for maximizing the benefits of this important partnership.
To get more insights into the latest US trade database, or to search live US import-export data by country, product, HS code, or company, visit USImportdata. Contact us at info@tradeimex.in for customized USA trade data reports, verified importer-exporter lists, and market insights.
What's Your Reaction?