US AC Imports by Country: Top AC Importers in the US & Imported Air Conditioner Data 2025
Discover detailed insights into US AC imports by country for 2024–2025. Explore the top air conditioner importers in the USA, import values, & key trends.
The air conditioning (AC) industry in the United States continues to be one of the most dynamic components of the global HVAC market. With climate extremes intensifying, building electrification expanding, and residential replacement demand rising, the U.S. market for air conditioners shows no sign of cooling off. According to the US import data and air conditioner import data of the USA, the total value of the US AC imports reached $15.38 billion in 2024, an 8% increase from the previous year. According to the US AC import data, the USA imported air conditioners worth $8.79 billion in the first two quarters of 2025.
This report presents a data-backed breakdown of U.S. AC imports in 2024–25, including trade values, import trends, supplier rankings, and strategic insights into the evolving supply landscape.
US AC Import Overview 2024–25
The U.S. imported around USD 15.3 billion worth of air-conditioning machines (HS 8415) in 2024. This includes all types of units, from residential window and split systems to large commercial rooftop units. When parts & components (HS 841590) are included, total import value rises sharply to over USD 24 billion, underscoring the deep global integration of the U.S. HVAC supply chain.
Many businesses today import AC units to meet the growing demand for cooling solutions. Many US businesses looking to import air conditioner from China are drawn by competitive pricing and a wide range of energy-efficient models tailored for global markets. Air conditioner importers ensure that customers have access to the latest global models with advanced energy-saving technology. When companies import air conditioner products, they focus on quality, durability, and efficiency to suit diverse climates. An imported air conditioner often offers superior performance and innovative features compared to locally made options, making it a preferred choice for both residential and commercial spaces.
In terms of physical volume, roughly 13 million air-conditioning units were imported into the United States in 2024. That’s a 3–4% increase over 2023, reflecting robust replacement demand in the residential and light commercial sectors.
Year-on-Year Import Growth
|
Year |
Import Value (USD Billion) |
YoY Change |
Import Volume (Million Units) |
|
2022 |
$13.9 billion |
— |
11.8 million units |
|
2023 |
$14.2 billion |
+6% |
12.5 million units |
|
2024 |
$15.3 billion |
+8% |
13 million units |
|
2025 (Projected) |
$16.5 billion |
+5–7% |
13.5 million units (est.) |
Growth has been consistent, with value rising faster than volume. This indicates a market shift toward higher-end, inverter-based, and energy-efficient units, which command higher prices.
US AC Imports by Country: Where Does the US Import Air Conditioners From?
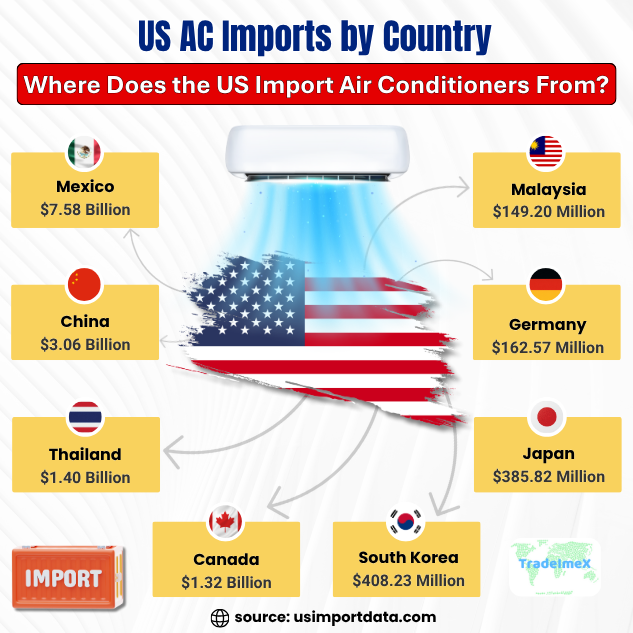
When it comes to air conditioning units, the United States relies heavily on imports from various countries around the world. In fact, a large percentage of the air conditioners used in the US are brought in from other nations. The United States imports air conditioners from various countries to meet the demand for cooling appliances. The major countries from which the US imports air conditioners include China, Mexico, South Korea, and Japan. The U.S. sources air conditioners and related parts from more than 40 countries, but the top five dominate total shipments. The breakdown for 2024 is as follows:
These countries are known for their high-quality HVAC products and technological advancements in the air conditioning industry, as per the AC export report 2024-25. Importing from a diverse range of countries helps ensure that the US market has access to a variety of air conditioning options & promotes healthy competition among manufacturers. The top 10 countries from where the USA imports air conditioners, as per the data on US air conditioner imports by country & the US shipment data for 2024-25, include:
1. Mexico: $7.58 Billion (49.3%)
Mexico tops the list as the leading importer of air conditioners to the US, accounting for a significant 49.3% share of the market. With a booming manufacturing industry and proximity to the US, Mexico has become a key supplier of air conditioning units to meet the cooling needs of American consumers.
2. China: $3.06 Billion (19.9%)
China is another major player in the US air conditioner import market, with a substantial 19.9% share, as per the data on US air conditioner imports from China by HS code. The country's high production capacity and competitive pricing make it a popular choice for US importers looking to source air conditioning units.
3. Thailand: $1.40 Billion (9.1%)
Thailand has also emerged as a significant supplier of air conditioners to the US, capturing a sizable 9.1% share of the market, as per the data on US air conditioner imports from Thailand. The country's strong manufacturing base and quality products have made it a preferred choice for US importers seeking reliable cooling solutions.
4. Canada: $1.32 Billion (8.6%)
Close neighbor Canada is another important source of air conditioners for the US market, holding an 8.6% share. The proximity of Canada to the US makes it a convenient and cost-effective option for importing air conditioning units.
5. South Korea: $408.23 Million (2.7%)
South Korea may have a smaller market share compared to other countries on the list, but it still plays a significant role in supplying air conditioners to the US. With advanced technology and innovative products, South Korean manufacturers are known for their high-quality air conditioning units.
6. Japan: $385.82 Million (2.5%)
Japan also holds a notable share of the US air conditioner import market, accounting for 2.5% of the total imports. Japanese air conditioning brands are renowned for their reliability, energy efficiency, and cutting-edge features, making them a popular choice among American consumers.
7. Germany: $162.57 Million (1.1%)
Germany may not be a top exporter of air conditioners to the US, but it still contributes significantly to the market with a 1.1% share. German-made air conditioning units are known for their quality engineering and innovative design.
8. Malaysia: $149.20 Million (1%)
Malaysia is another country that supplies air conditioners to the US, with a modest 1% market share. Malaysian manufacturers offer a variety of air conditioning options, catering to different consumer preferences and budget ranges.
9. Italy: $127.90 Million (0.8%)
Italy may have a relatively small share of the US air conditioner import market, but it is known for its stylish and sophisticated air conditioning units. Italian brands focus on aesthetics and performance, making them a popular choice for design-conscious consumers.
10. Jordan: $95.99 Million (0.6%)
Jordan rounds out the list of countries from which the US imports air conditioners, capturing a 0.6% market share. Despite its smaller presence in the market, Jordanian manufacturers offer unique air conditioning solutions that cater to specific consumer needs.
Top AC Buyers & Importers in the USA: US Air Conditioner Importers Database
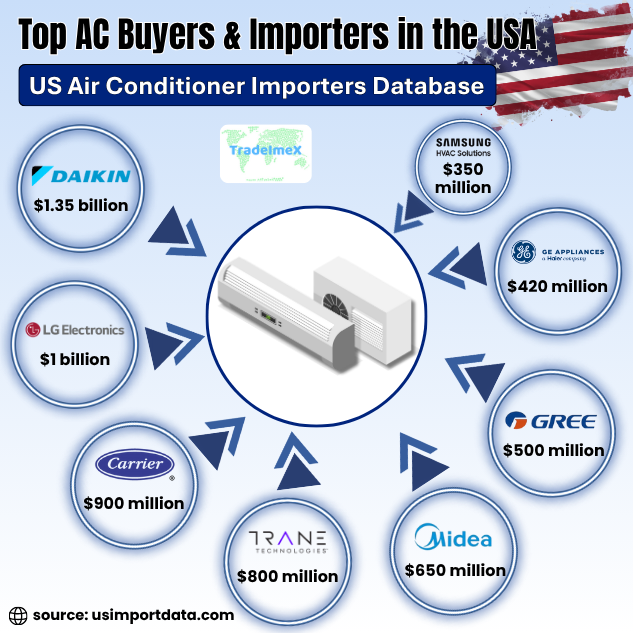
The US Air Conditioner Importers Database provides valuable information on the top AC buyers and importers in the USA, catering to businesses looking to establish partnerships or expand their market reach. This database offers a comprehensive list of key players in the industry, making it an essential resource for companies seeking to connect with potential air conditioner buyers and importers in the American market. The leading air conditioner importers in the US, as per the USA AC importers data & AC buyers list for 2024-25, include:
|
Rank |
Company Name |
Approx. Import Value (2024) |
Top Imported Types |
Main Import Source Countries |
|
1 |
Daikin Comfort Technologies USA, Inc. |
$1.35 billion |
Split ACs, VRV/VRF systems, commercial HVAC units |
Thailand, Japan, Malaysia, Mexico |
|
2 |
LG Electronics USA, Inc. |
$1 billion |
Ductless mini-splits, inverter ACs, smart wall-mounted systems |
South Korea, Thailand, Vietnam |
|
3 |
Carrier Global Corporation |
$900 million |
Central AC systems, rooftop units, compressors & coils |
Mexico, Thailand, Japan |
|
4 |
Trane Technologies plc (U.S. operations) |
$800 million |
Commercial ACs, packaged rooftop units, parts |
Mexico, China, Thailand |
|
5 |
Midea America Corp. |
$650 million |
Window & portable ACs, split systems |
China, Vietnam, Malaysia |
|
6 |
Gree Electric Appliances USA, Inc. |
$500 million |
Split and wall-mounted ACs, inverter systems |
China, Thailand |
|
7 |
Haier America (incl. GE Appliances) |
$420 million |
Residential window units, portable ACs |
China, Vietnam |
|
8 |
Samsung HVAC America |
$350 million |
Premium split ACs, smart & Wi-Fi-enabled systems |
South Korea, Thailand |
|
9 |
Panasonic USA HVAC Systems |
$300 million |
Mini-splits, energy-efficient inverter ACs |
Japan, Malaysia, Thailand |
|
10 |
Whirlpool Corporation (with Hisense JV imports) |
$200 million |
Window ACs, portable air conditioners |
China, Vietnam |
Key Insights
-
Daikin remains the largest U.S. AC importer, surpassing USD 1.3 billion in imported air conditioners and related HVAC systems in 2024.
-
The combined import value of the top 10 companies in 2024 was around USD 6 – 6.4 billion, accounting for roughly 85% of all U.S. AC imports for the year.
-
Asian suppliers dominate, particularly China, Thailand, South Korea, Japan, and Vietnam, providing over 80% of total imported units by volume.
-
Mexico has become the leading parts and subassembly supplier, benefiting from USMCA trade advantages and nearshoring trends.
-
Smart inverters and energy-efficient ACs (imported mainly from South Korea and Japan) make up roughly 45–50% of the total imported value.
-
China still leads in volume, especially for lower-cost window and portable units, but its market share is slowly shrinking as brands diversify sources.
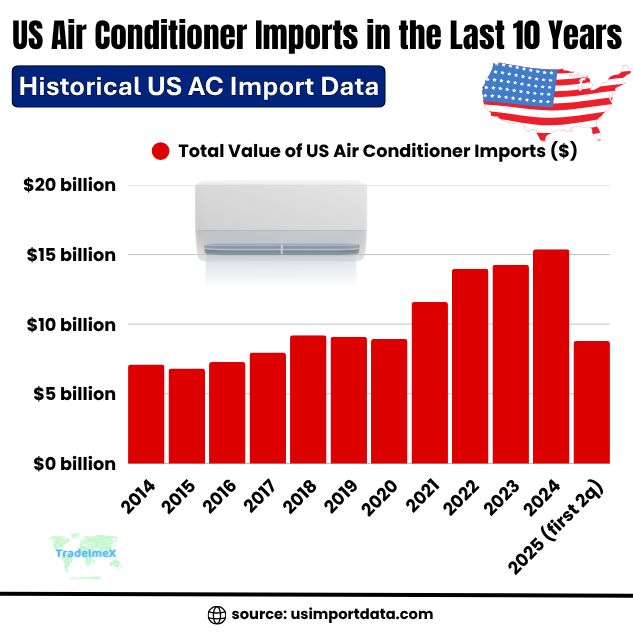
US Air Conditioner Imports in the Last 10 Years: Historical US AC Import Data
|
Year of Imports |
Total Value of US Air Conditioner Imports ($) |
|
2014 |
$7.11 billion |
|
2015 |
$6.82 billion |
|
2016 |
$7.28 billion |
|
2017 |
$7.97 billion |
|
2018 |
$9.21 billion |
|
2019 |
$9.09 billion |
|
2020 |
$8.94 billion |
|
2021 |
$11.59 billion |
|
2022 |
$13.98 billion |
|
2023 |
$14.27 billion |
|
2024 |
$15.38 billion |
|
2025 (first 2 quarters) |
$8.79 billion |
Types of Air Conditioners Imported by the US
The U.S. import mix for air-conditioning equipment includes several major product categories:
|
Category |
Share of Imports (by Units) |
Description |
|
Split Air Conditioners |
45% |
Wall-mounted or ductless units for homes and small businesses. Mostly imported from China, Thailand, and South Korea. |
|
Window AC Units |
25% |
Traditional residential window ACs, mainly from China and Indonesia. |
|
Portable Units |
10% |
Compact plug-in models for residential use, largely from China. |
|
Commercial Rooftop / VRF Systems |
10% |
Larger systems used in offices and commercial buildings; imported from Japan, Korea, and Mexico. |
|
Parts and Components |
10% (by value) |
Compressors, coils, control panels, fans, and refrigerant assemblies. Mostly from Mexico, China, and Thailand. |
The share of ductless split systems has risen rapidly, overtaking window units as the dominant category due to their efficiency, zoning capability, and compatibility with heat-pump technology.
U.S. Imports of AC Parts & Components
Beyond finished machines, the U.S. imports a significant volume of parts for air-conditioning machines (HS 841590). These imports support domestic assembly lines, after-sales service networks, and component replacement demand. In 2024, total U.S. imports of AC parts were estimated at USD 9.9 billion, nearly double the value of finished-unit imports, as per the AC parts import data of USA by HS code.
Top Sources of AC Parts (2024)
|
Rank |
Country |
Import Value (USD Million) |
Share of Total |
Key Components |
|
1 |
Mexico |
$5.4 billion |
55% |
Compressors, heat exchangers, & fan motors |
|
2 |
China |
$2.1 billion |
21% |
Electronic controls, small compressors, coils |
|
3 |
Thailand |
$738 million |
7% |
Condensers, coils, casings |
|
4 |
Canada |
$412 million |
4% |
High-efficiency components, sensors |
|
5 |
Japan |
$309 million |
3% |
VRF system parts, inverter drives |
This parts-heavy trade pattern shows how U.S. HVAC manufacturers rely on imported subassemblies, even when the final unit is assembled domestically.
US AC Import Trends and Growth Drivers
1. Rising Residential Demand
Record-breaking heat waves and aging housing stock continue to drive the replacement of older, inefficient systems. In 2024, nearly 70% of AC imports were directed toward residential and light commercial use.
2. Technological Upgrading
Imports increasingly include inverter-driven and “smart” air conditioners with Wi-Fi connectivity and AI-based temperature regulation. These units are higher value, driving up average import prices by around 4–5% annually.
3. Energy Efficiency Regulations
New Department of Energy (DOE) efficiency standards, effective from 2023–2024, are pushing OEMs to import newer-generation units that meet SEER2 and HSPF2 standards. Imports from South Korea and Japan have grown in premium categories as a result.
4. Supply Chain Realignment
After the COVID-era supply disruptions and trade tariffs, U.S. importers diversified sources beyond China. Thailand, Vietnam, and Mexico saw double-digit growth in shipments in 2024 as part of this diversification wave.
5. Integration of Heat Pump Systems
With U.S. policy incentives promoting electrification and decarbonization, imports of air-source heat pumps, a close relative of traditional AC units, rose 12% in 2024. Much of this growth came from Japanese and Korean manufacturers.
US AC Market Dynamics: Import Pricing, Volume, and Shifts
|
Indicator |
2022 |
2023 |
2024 |
2025 (Forecast) |
|
Average Unit Price (USD) |
390 |
400 |
415 |
435 |
|
Import Volume (Million Units) |
11.8 |
12.5 |
13.0 |
13.5 |
|
Import Value (USD Billion) |
4.6 |
4.9 |
5.2 |
5.5–5.6 |
|
Share of Smart/Inverter Units |
35% |
42% |
48% |
55% |
|
Share from China (by Units) |
72% |
70% |
68% |
64% |
The steady drop in China’s share of total imports, though still dominant, reflects an intentional diversification strategy by U.S. AC importers. Thailand and Vietnam have been among the fastest-growing alternative suppliers.
Key U.S. AC Importers and Distribution Channels
While Customs-level import data primarily identifies shipment origins, domestic importers and distributors play a major role in the U.S. AC market.
Leading U.S. Importers and Distributors (2024)
|
Company |
Nature of Business |
Primary Imported Brands/Regions |
|
Daikin Comfort Technologies (US arm of Daikin Japan) |
Imports residential & commercial AC units |
Japan, Thailand, Malaysia |
|
LG Electronics USA |
Premium and smart AC systems |
South Korea |
|
Midea America Corp. |
Low and mid-range split/window ACs |
China |
|
Gree Electric USA |
Wall-mounted and portable AC units |
China |
|
Carrier Global Corporation |
Imports components and VRF systems |
Mexico, Thailand, Japan |
|
Trane Technologies |
Imports compressors and modules |
Mexico, China |
|
Haier America |
Residential ACs and parts |
China |
|
Samsung HVAC America |
Ductless systems, heat pumps |
South Korea |
|
Panasonic USA HVAC |
Energy-efficient mini-splits |
Japan, Malaysia |
|
Whirlpool / Hisense partnerships |
Window and portable ACs |
China, Vietnam |
Most large importers combine imported components with domestic assembly or branding before distribution through retail, wholesale, or contractor channels.
Trade Patterns and Geopolitical Factors
Tariffs and Policy Impacts
Although broad U.S. tariffs on Chinese imports remain, most finished AC units and key parts fall under exempt or low-tariff categories. However, parts & metal subassemblies from Mexico may face tariff volatility due to policy revisions under the USMCA review in 2025.
Nearshoring Trend
The strong role of Mexico, accounting for over USD 5 billion in AC parts exports to the U.S., highlights a major nearshoring trend. Manufacturers are moving subassembly operations closer to the U.S. to mitigate logistics costs, currency risk, and tariffs.
Currency and Cost Pressures
Appreciation of the U.S. dollar against Asian currencies in late 2024 helped stabilize import costs despite rising raw material prices for aluminum, copper, and refrigerants.
2025 Outlook and Forecast
Import Value & Volume Outlook
U.S. AC imports in 2025 are projected to reach USD 5.5–5.6 billion for finished units, and around USD 10 billion for parts, representing combined trade exceeding USD 15 billion. Volume imports may rise modestly to 13.5 million units, with average unit prices increasing due to the continued shift toward premium systems.
Supply Source Outlook
-
Mexico: Expected to remain the top supplier, but its share may drop below 50%.
-
Thailand and Vietnam: Likely to capture 2–3% additional market share due to strong production bases for major OEMs.
-
China: Could expand its dominance in parts and begin exporting more complete units as assembly capacity expands.
-
South Korea and Japan: Expected to maintain strong positions in the premium and smart HVAC segment.
Structural Changes Ahead
-
Heat Pump Imports: As the U.S. Energy Department’s electrification initiatives expand, imports of air-source heat pumps are projected to grow by 10–12% annually through 2026.
-
Smart HVAC Growth: More than half of new imports by 2025 are expected to include IoT or AI energy management features.
-
Sustainability Pressure: Stricter refrigerant regulations (HFC phase-down) will favor suppliers that transition early to low-GWP refrigerants.
-
Trade Optimization: Importers are investing in U.S.-based trade hubs near ports (Los Angeles, Houston, and Savannah) to manage supply volatility.
Summary and Strategic Insights
-
The U.S. imported over USD 15 billion worth of air-conditioning machines in 2024, plus another USD 9.9 billion in parts and components, confirming its position as the largest AC importer globally.
-
China remains dominant, supplying nearly 70% of finished units, though diversification is increasing with Thailand, Vietnam, and Mexico rising as key alternative sources.
-
Mexico leads in AC parts, shipping nearly USD 5 billion worth in 2024, supported by North American integration and geographic proximity.
-
The average unit price of imported ACs rose by about 4% in 2024, reflecting a shift toward premium, inverter-driven, and energy-efficient systems.
-
Growth is expected to continue at 5–7% annually through 2025, driven by extreme weather, building modernization, and green-energy policies.
-
Key risks include tariffs, bottlenecks, and over-dependence on Asian suppliers, but nearshoring and technological innovation provide mitigating opportunities.
Conclusion and Final Takeaway
The U.S. air-conditioning import landscape is in transition. China’s supply dominance is slowly giving way to a more diversified, technologically advanced, and sustainability-oriented global sourcing model. At the same time, Mexico’s integration into the HVAC supply chain is deepening, suggesting that North America is emerging as a dual hub for both assembly and parts.
In 2025 and beyond, as efficiency standards tighten and climate patterns intensify, demand for advanced, connected, and eco-friendly air-conditioning systems will continue to grow. The U.S. air conditioner import market, already massive, will remain the critical node in the global HVAC trade network.
For more information on the latest US export-import data, or to search live data on US AC imports by country, visit USImportdata. Contact us at info@tradeimex.in for customized trade reports, market insights, and a verified database of the top air conditioner buyers & importers in the USA, as per your business needs.
What's Your Reaction?